The Semiconductor Titans: Breaking Down NVIDIA and AMD's Q2 2025 Performance
In a quarter marked by continued AI acceleration and global chip demand, semiconductor giants NVIDIA and AMD have recently reported their Q2 2025 financial results, revealing critical insights into the competitive landscape of high-performance computing. The numbers tell a compelling story of NVIDIA's continued market dominance while highlighting AMD's strategic efforts to expand its AI footprint.
NVIDIA: Maintaining Momentum in Data Center Dominance
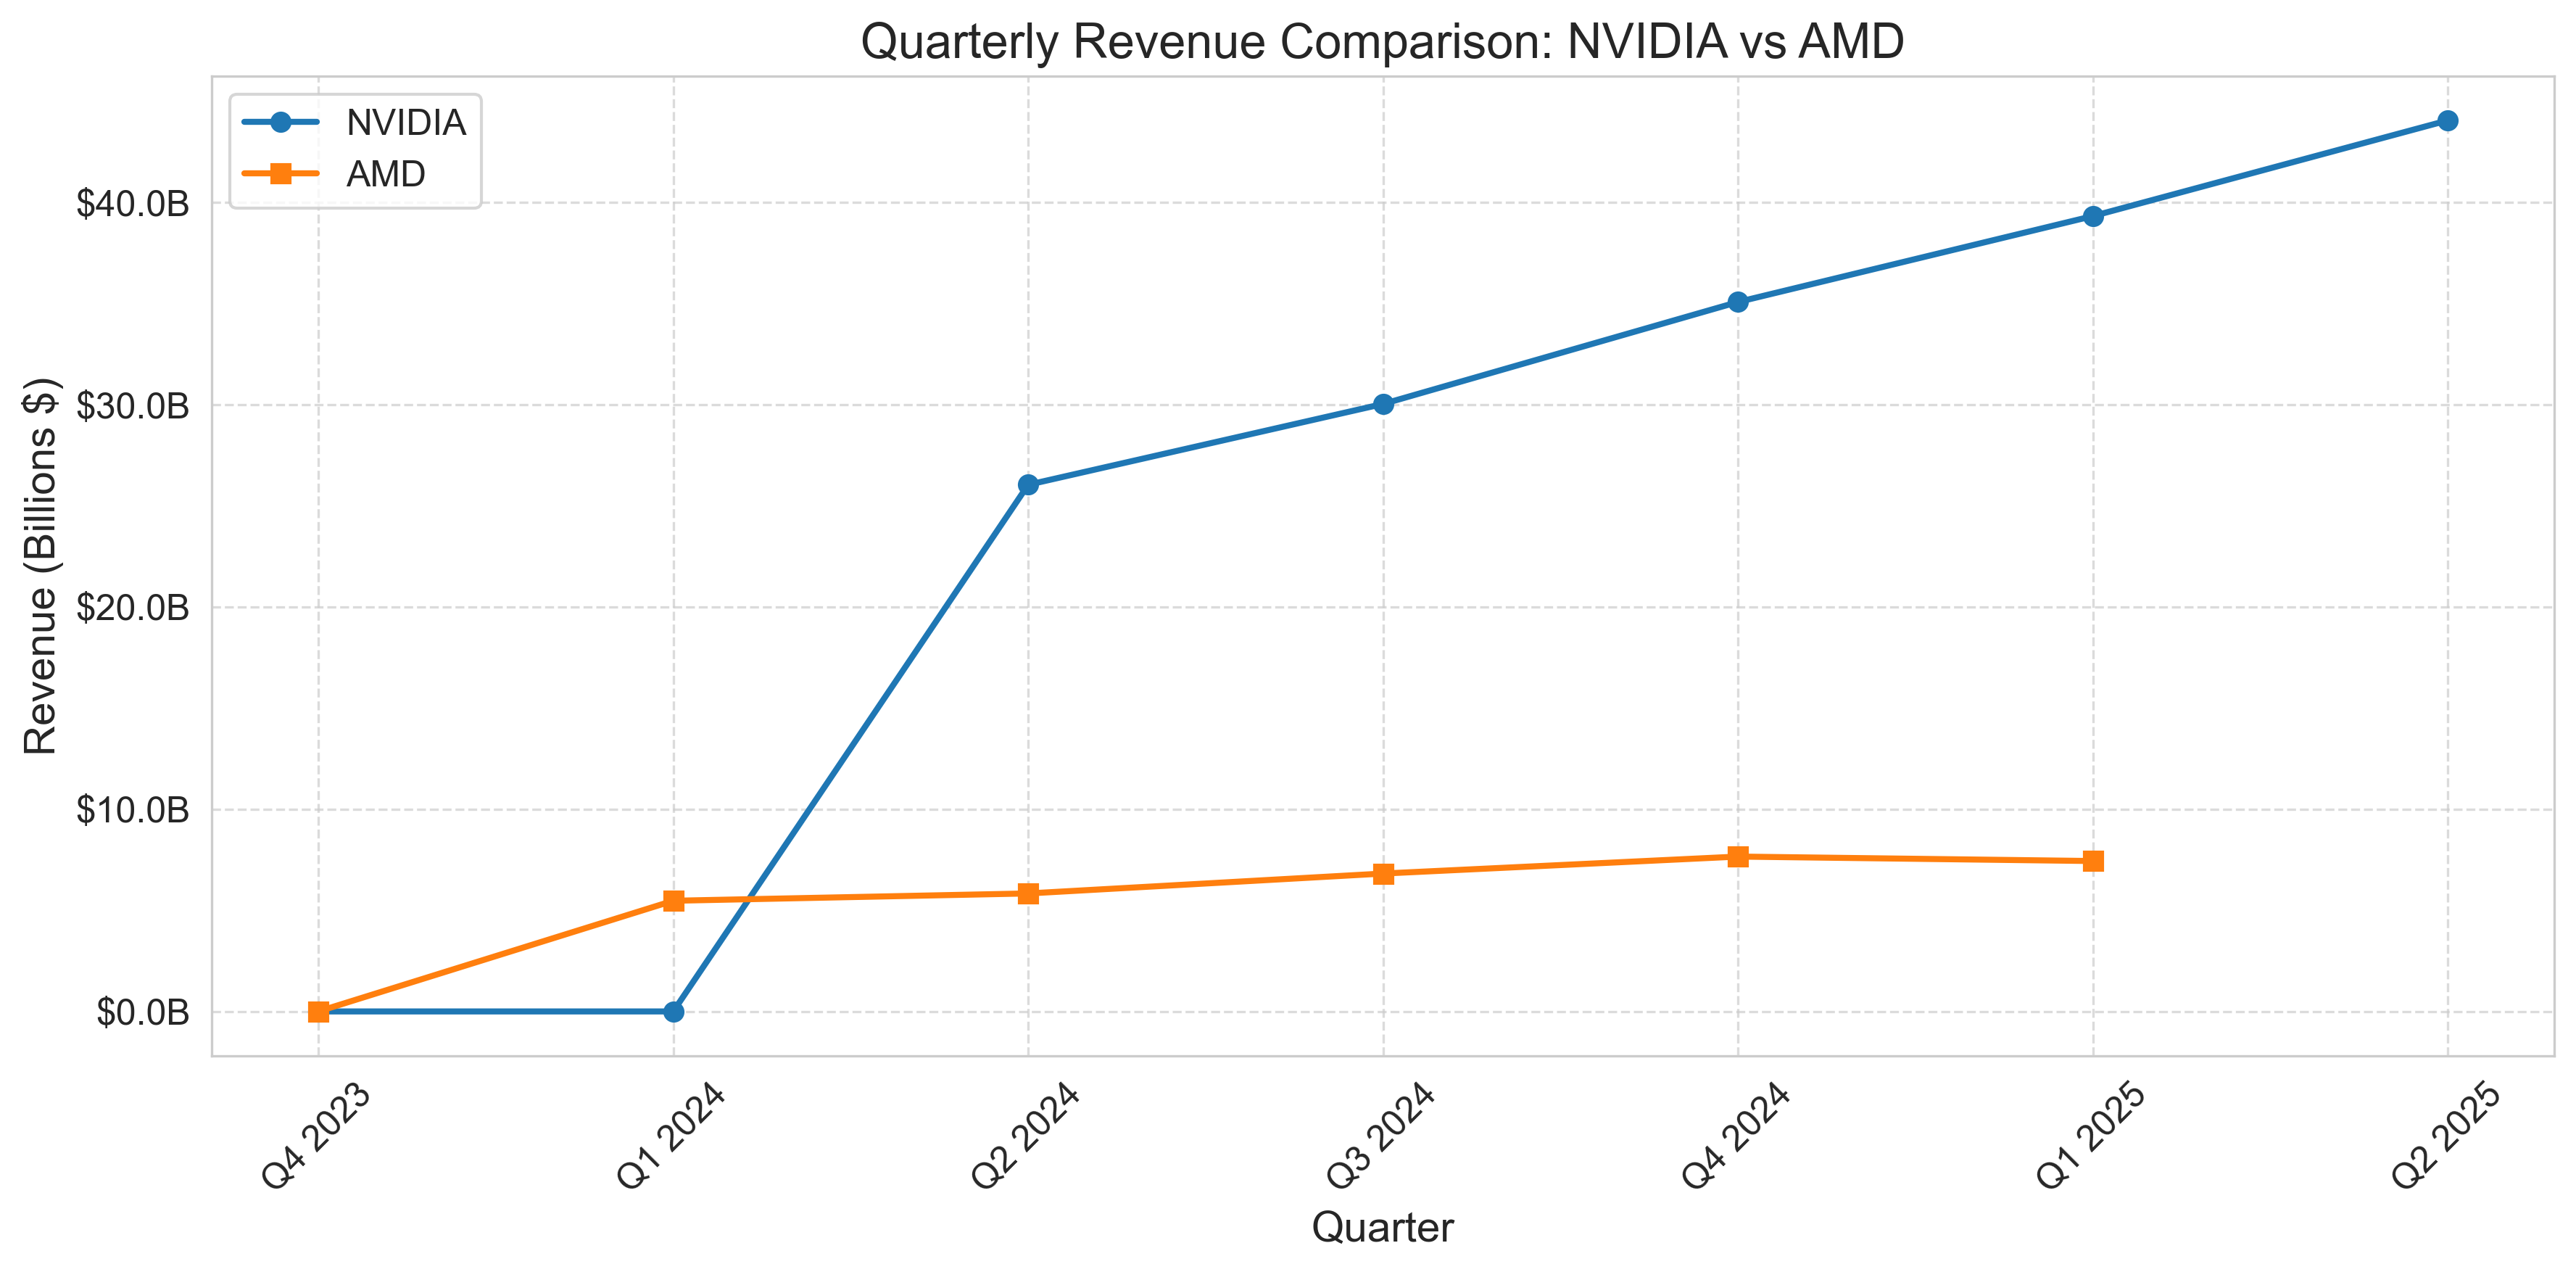
NVIDIA's data center segment continues to be the primary growth engine for the company, with the division posting unprecedented revenues. The company's Q2 2025 total revenues reached $44.1 billion, exceeding analyst consensus estimates of $42.8 billion and representing a remarkable 69% year-over-year growth rate. This performance extends NVIDIA's impressive growth trajectory throughout fiscal 2025 as demand for AI accelerators shows no signs of slowing.
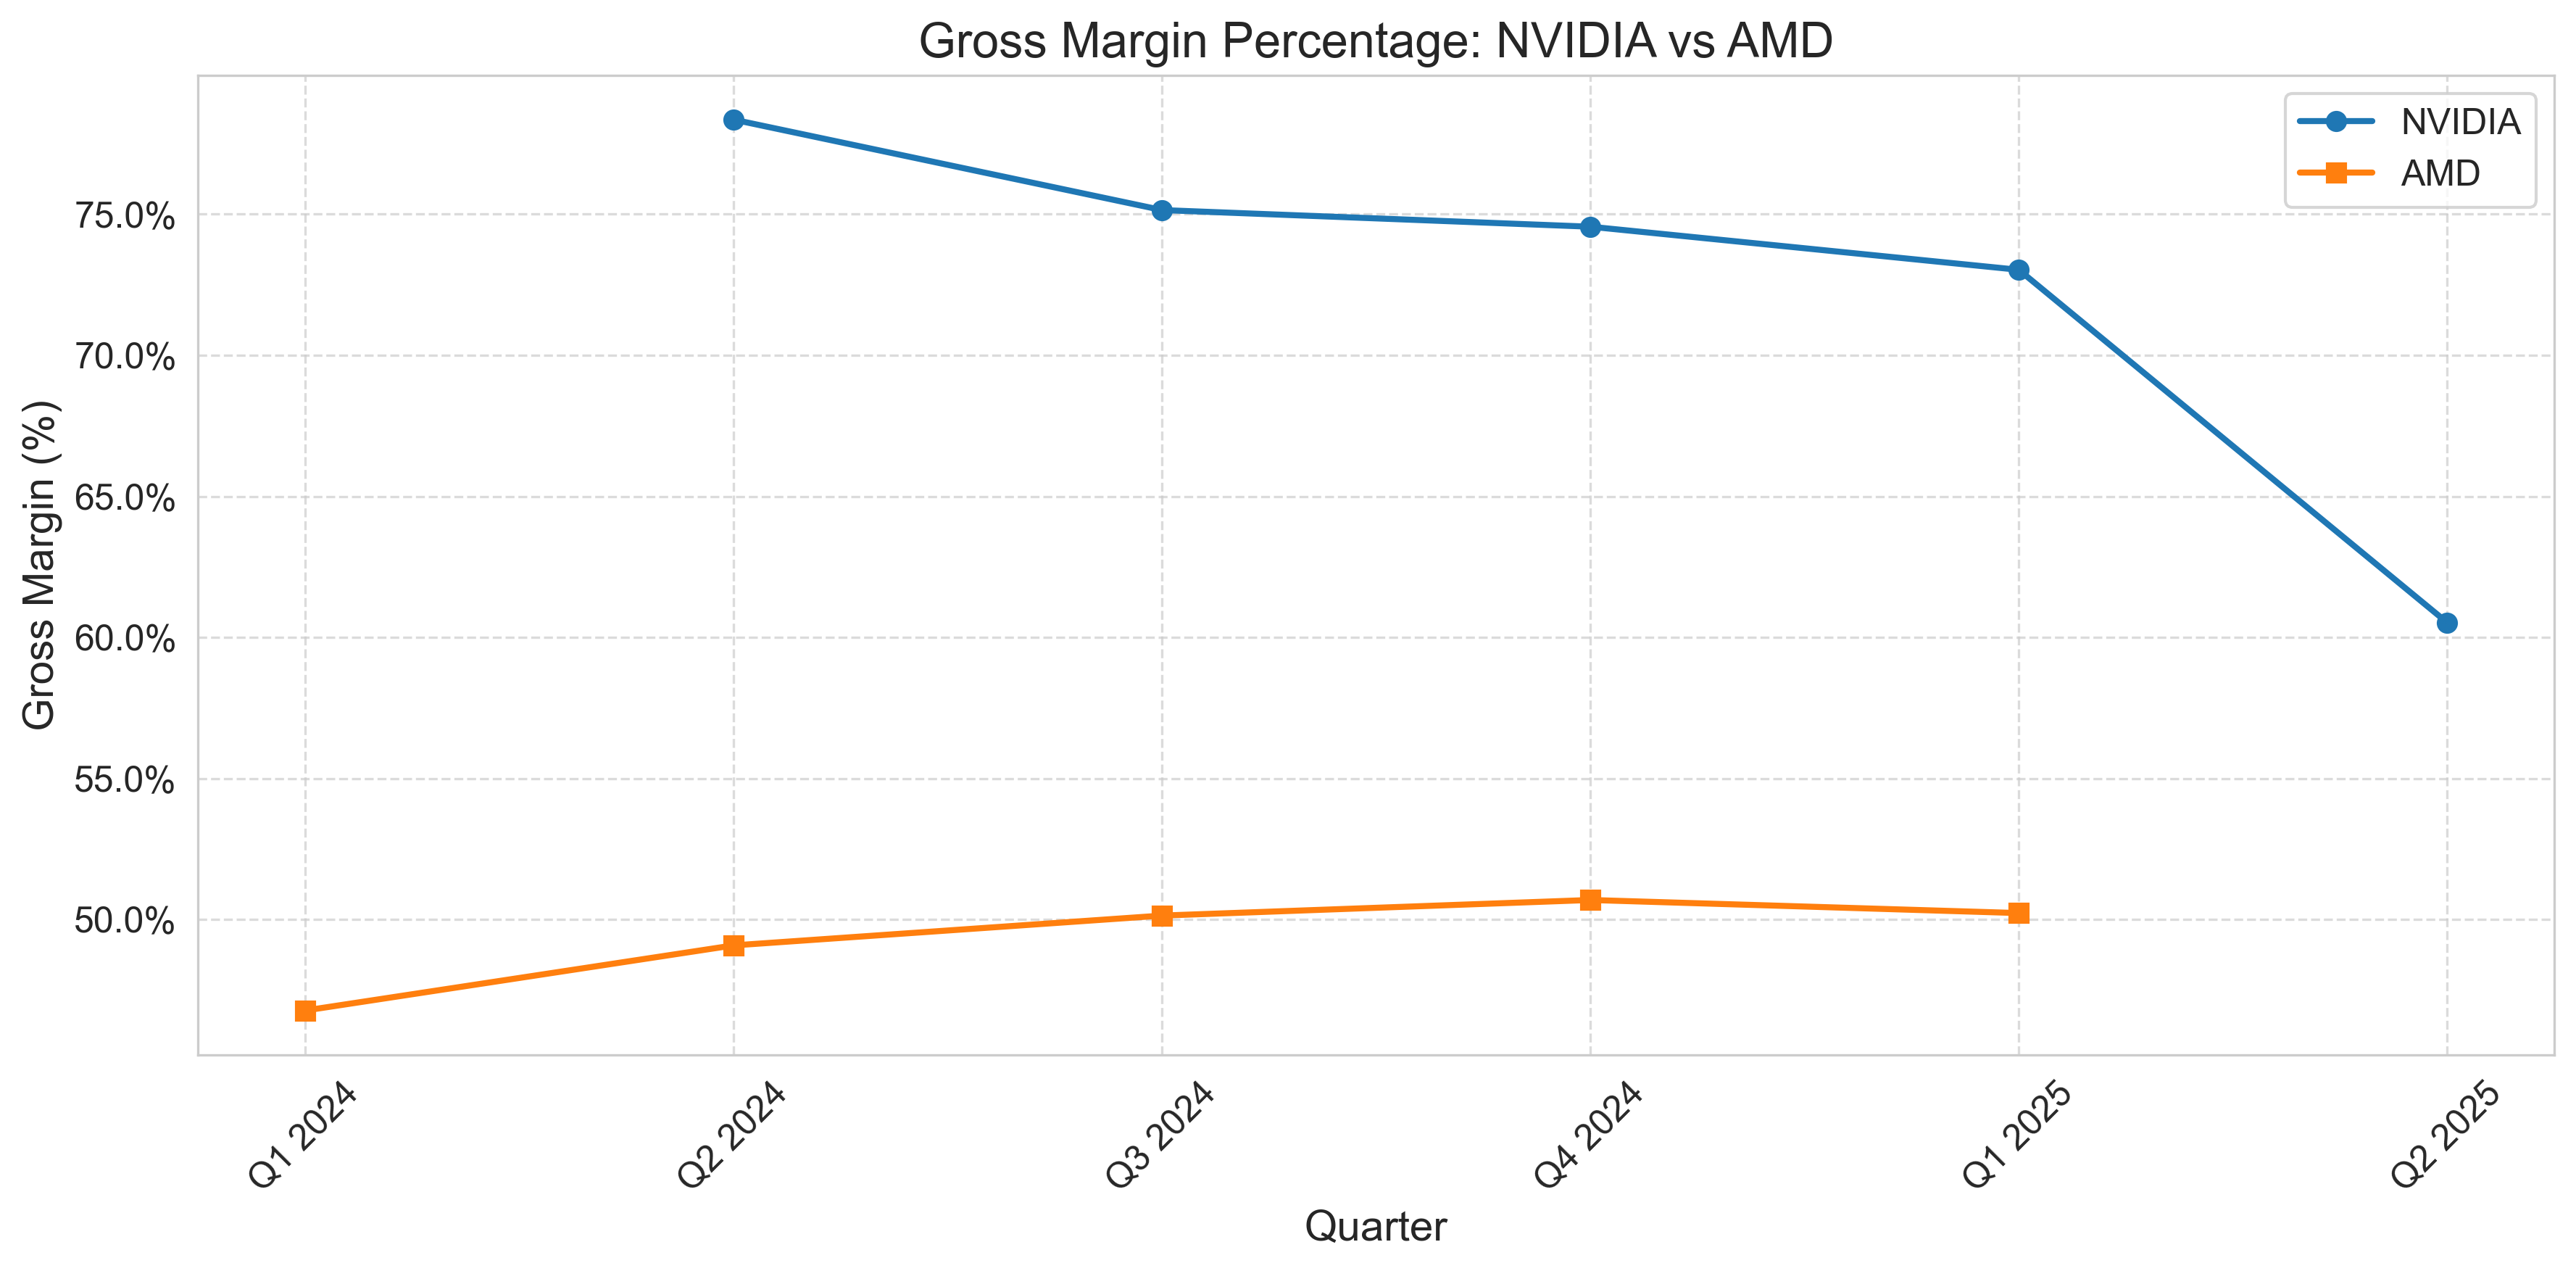
Particularly noteworthy is NVIDIA's gross margin, which registered at 60.5% in Q2 2025. While this represents a decline from the extraordinary 78% margins seen in early 2024, it still demonstrates the company's pricing power and operational efficiency despite increasing competition and production costs. The company's operating margin stands at an impressive 49.1%, allowing it to generate substantial cash flow for continued R&D investments.
AMD: Expanding AI Footprint
Meanwhile, AMD has been working to strengthen its position in the AI accelerator market with its MI300 series competing directly against NVIDIA's offerings. AMD reported Q1 2025 revenue of $7.4 billion, reflecting a respectable 36% year-over-year growth rate. While this growth is substantial, it hasn't matched NVIDIA's exceptional 69% pace, highlighting the gap that remains between the two competitors in the AI chip market.
AMD's gross margin has shown steady improvement, reaching 50.2% in the most recent quarter. This reflects the company's strategic shift toward higher-margin data center and AI products, moving away from its historical reliance on lower-margin consumer CPU and GPU segments. However, AMD's operating margin of 10.8% still significantly trails NVIDIA's industry-leading profitability.
R&D Investment: Fueling Future Innovation
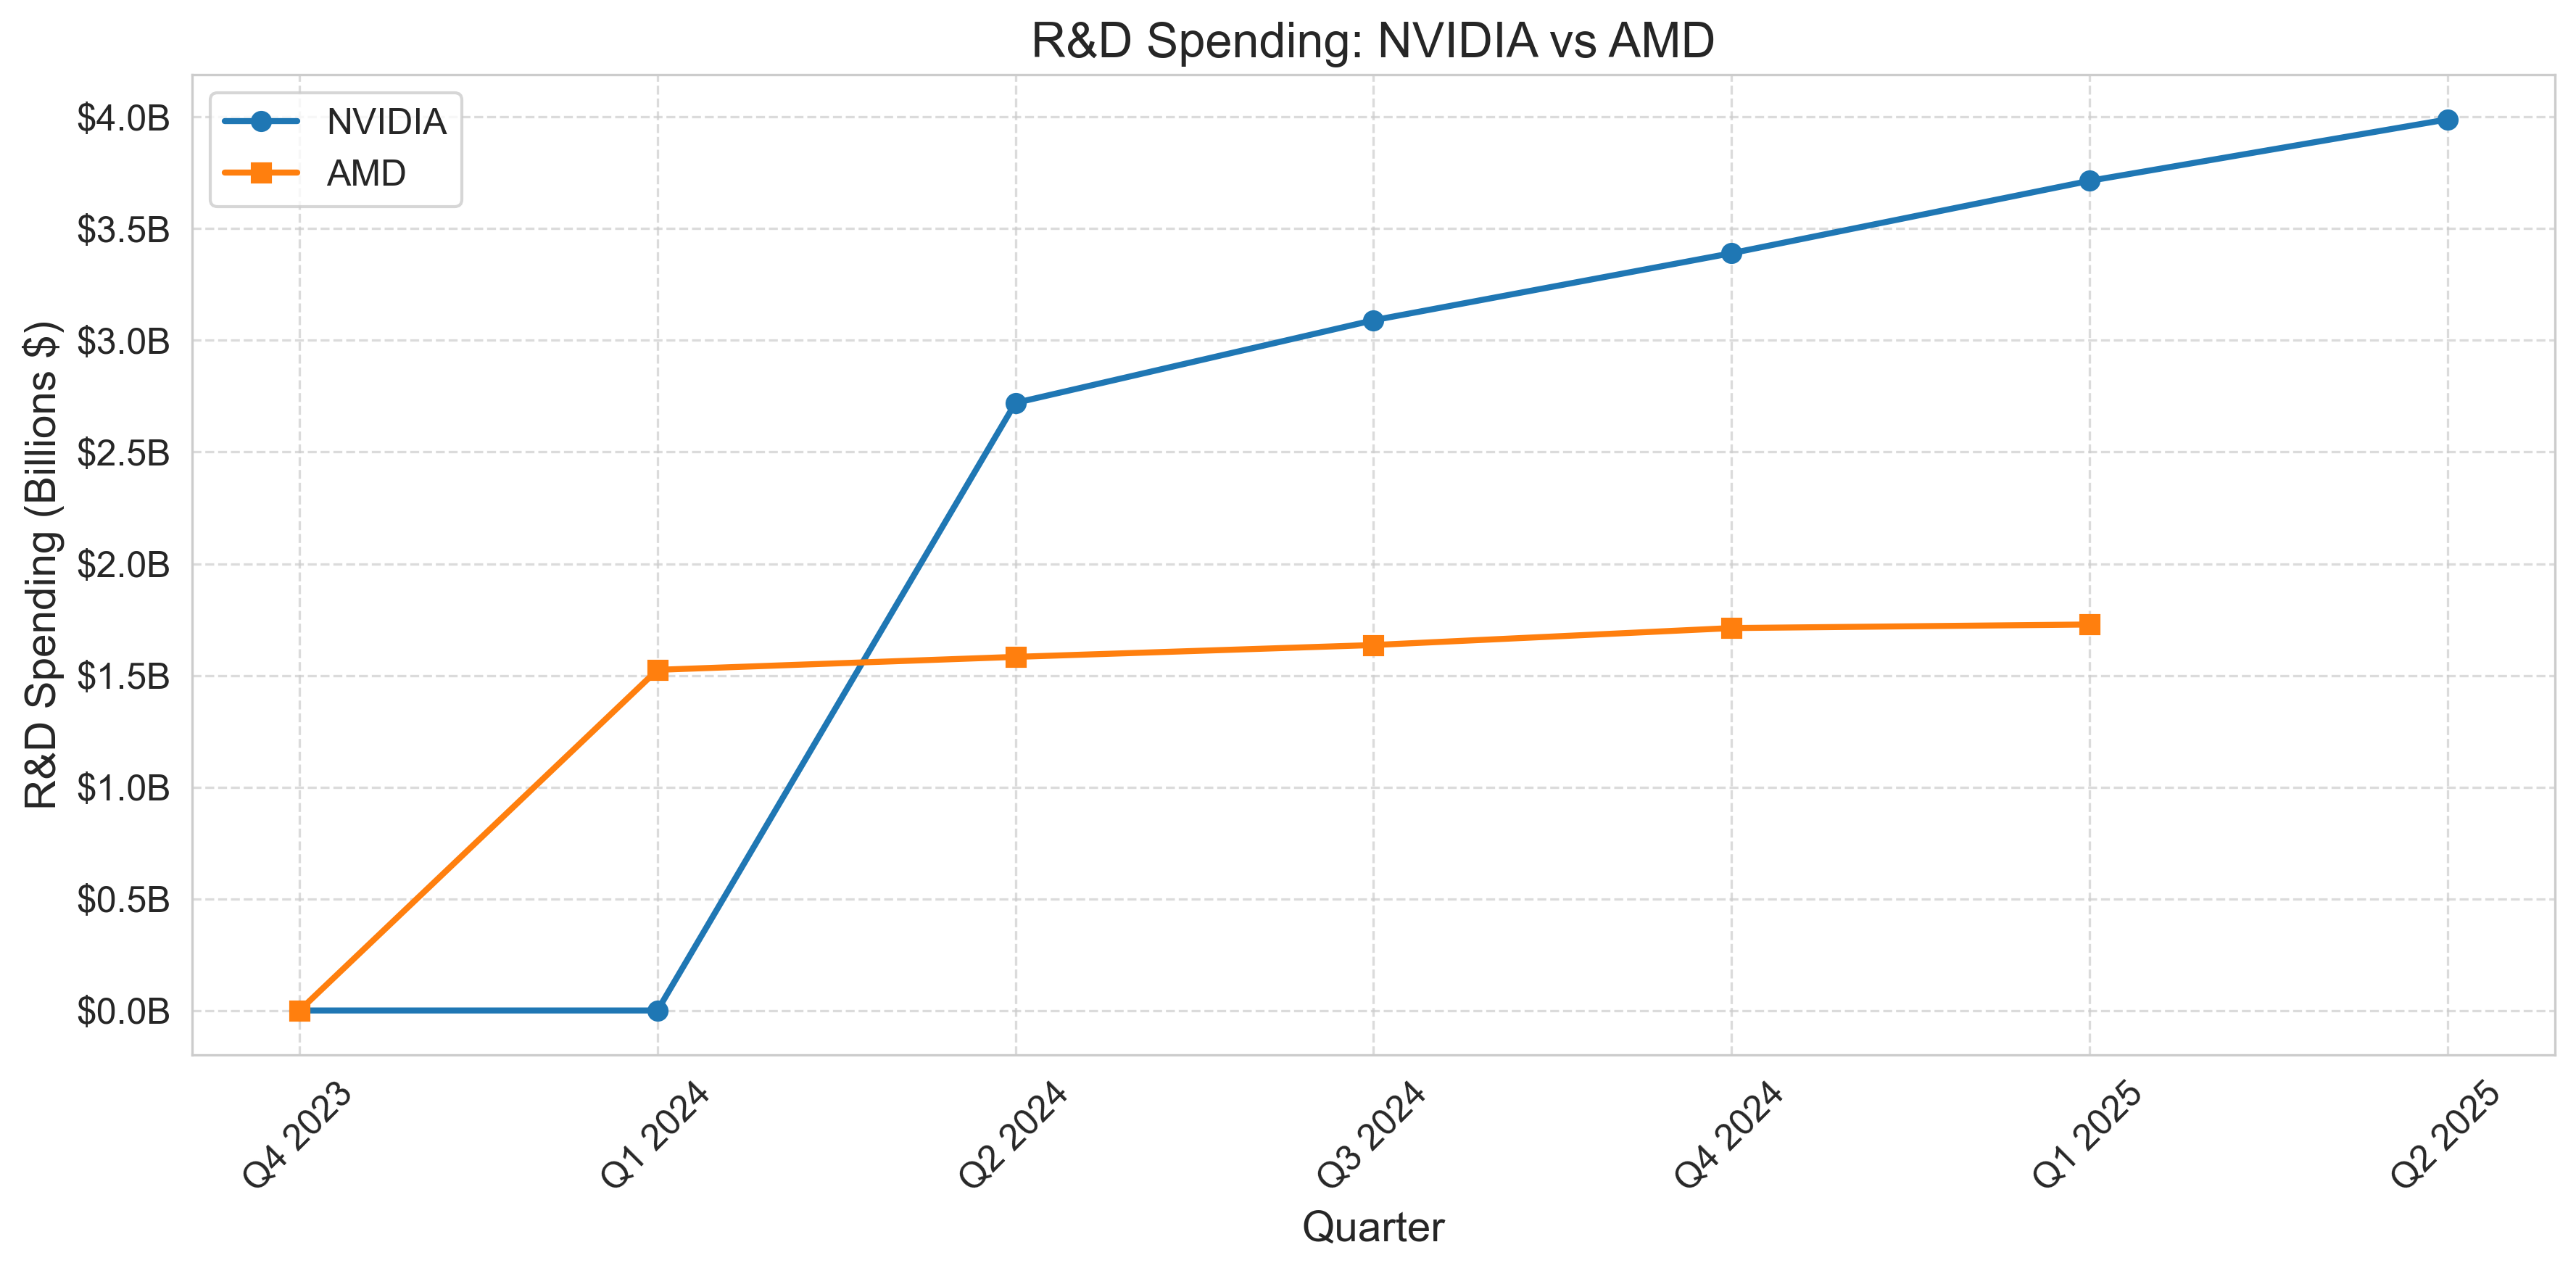
The battle for AI chip supremacy is fundamentally a race of innovation, making research and development investments a critical indicator of future competitiveness. NVIDIA has significantly ramped up its R&D spending to $4.0 billion in the most recent quarter, representing 9.1% of its revenue. Over the past four quarters, NVIDIA has invested a staggering $14.2 billion in R&D, reflecting its commitment to maintaining its technological leadership.
AMD has also prioritized R&D, spending $1.7 billion (23.2% of revenue) in its most recent quarter. While the absolute dollar amount is less than half of NVIDIA's spending, AMD is actually investing a higher percentage of its revenue in R&D, demonstrating its strategic commitment to closing the performance gap with NVIDIA's AI accelerators.
Cash Flow and Balance Sheet Strength
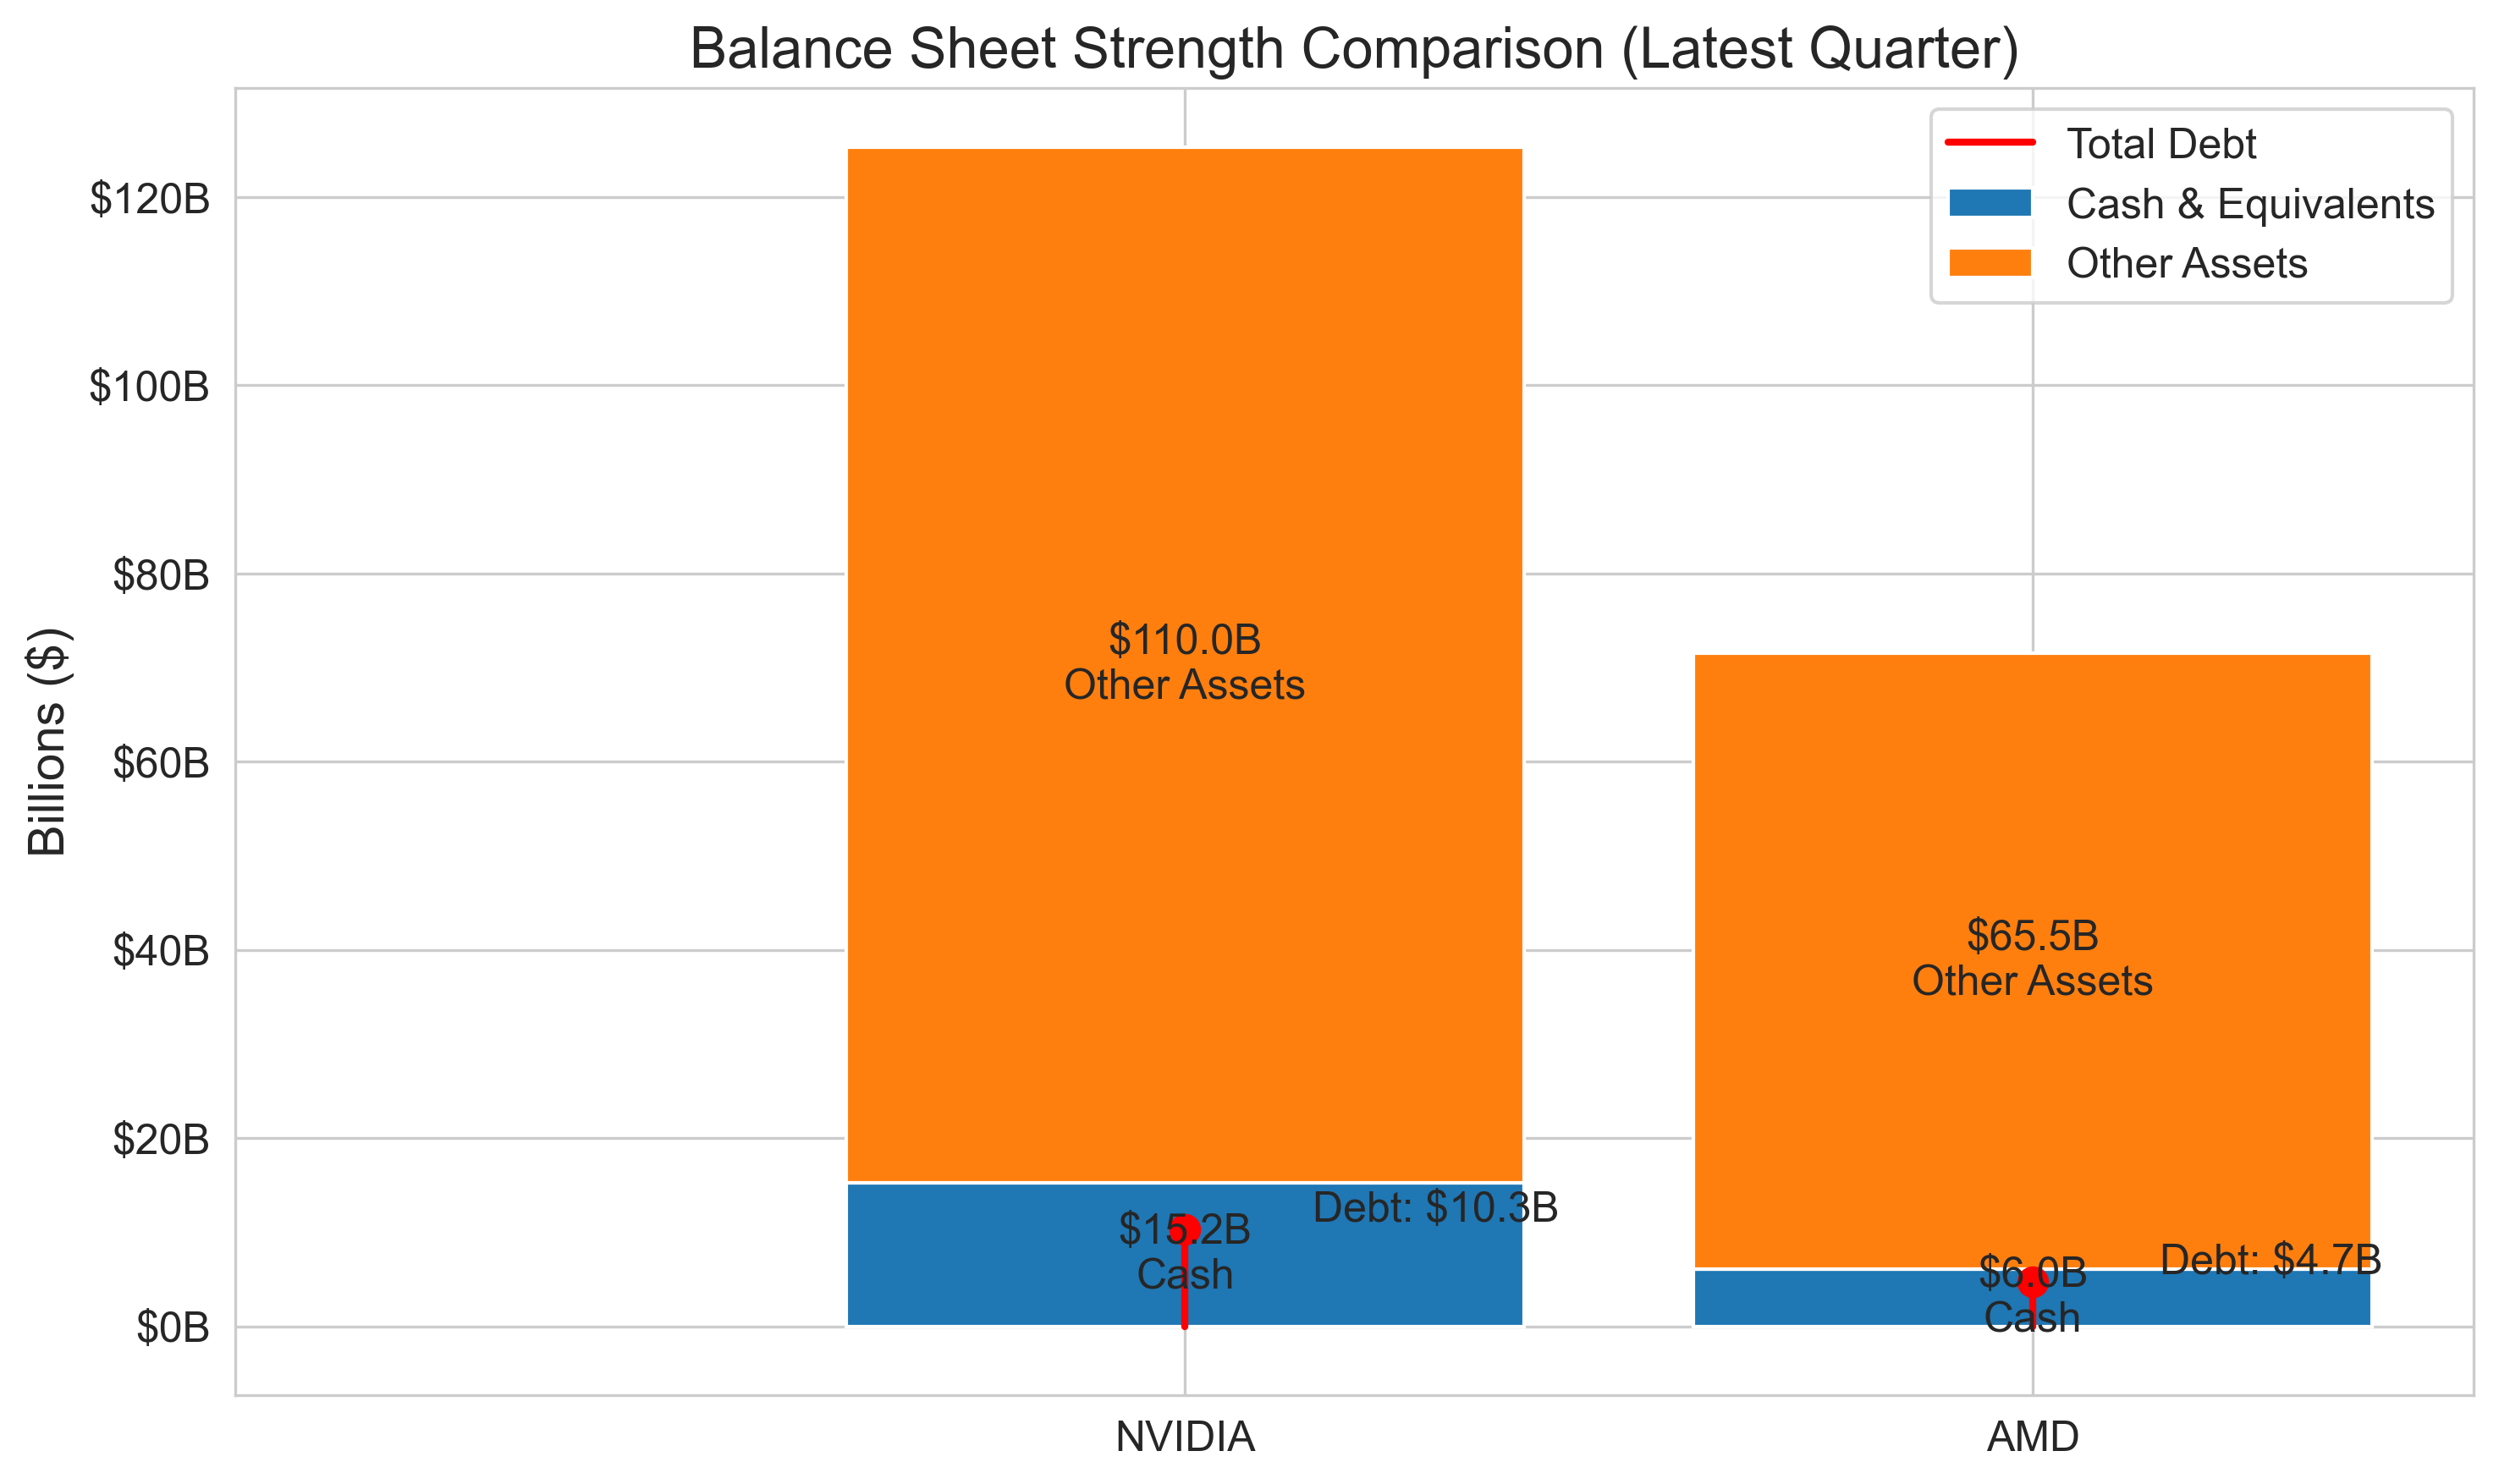
Beyond revenue and profitability, cash flow generation capabilities significantly impact these companies' abilities to invest in R&D and maintain technological leadership. NVIDIA generated an extraordinary $26.2 billion in free cash flow in Q2 2025, providing immense financial flexibility. The company's balance sheet shows $15.2 billion in cash and equivalents against $10.3 billion in debt, yielding a net cash position of $4.9 billion.
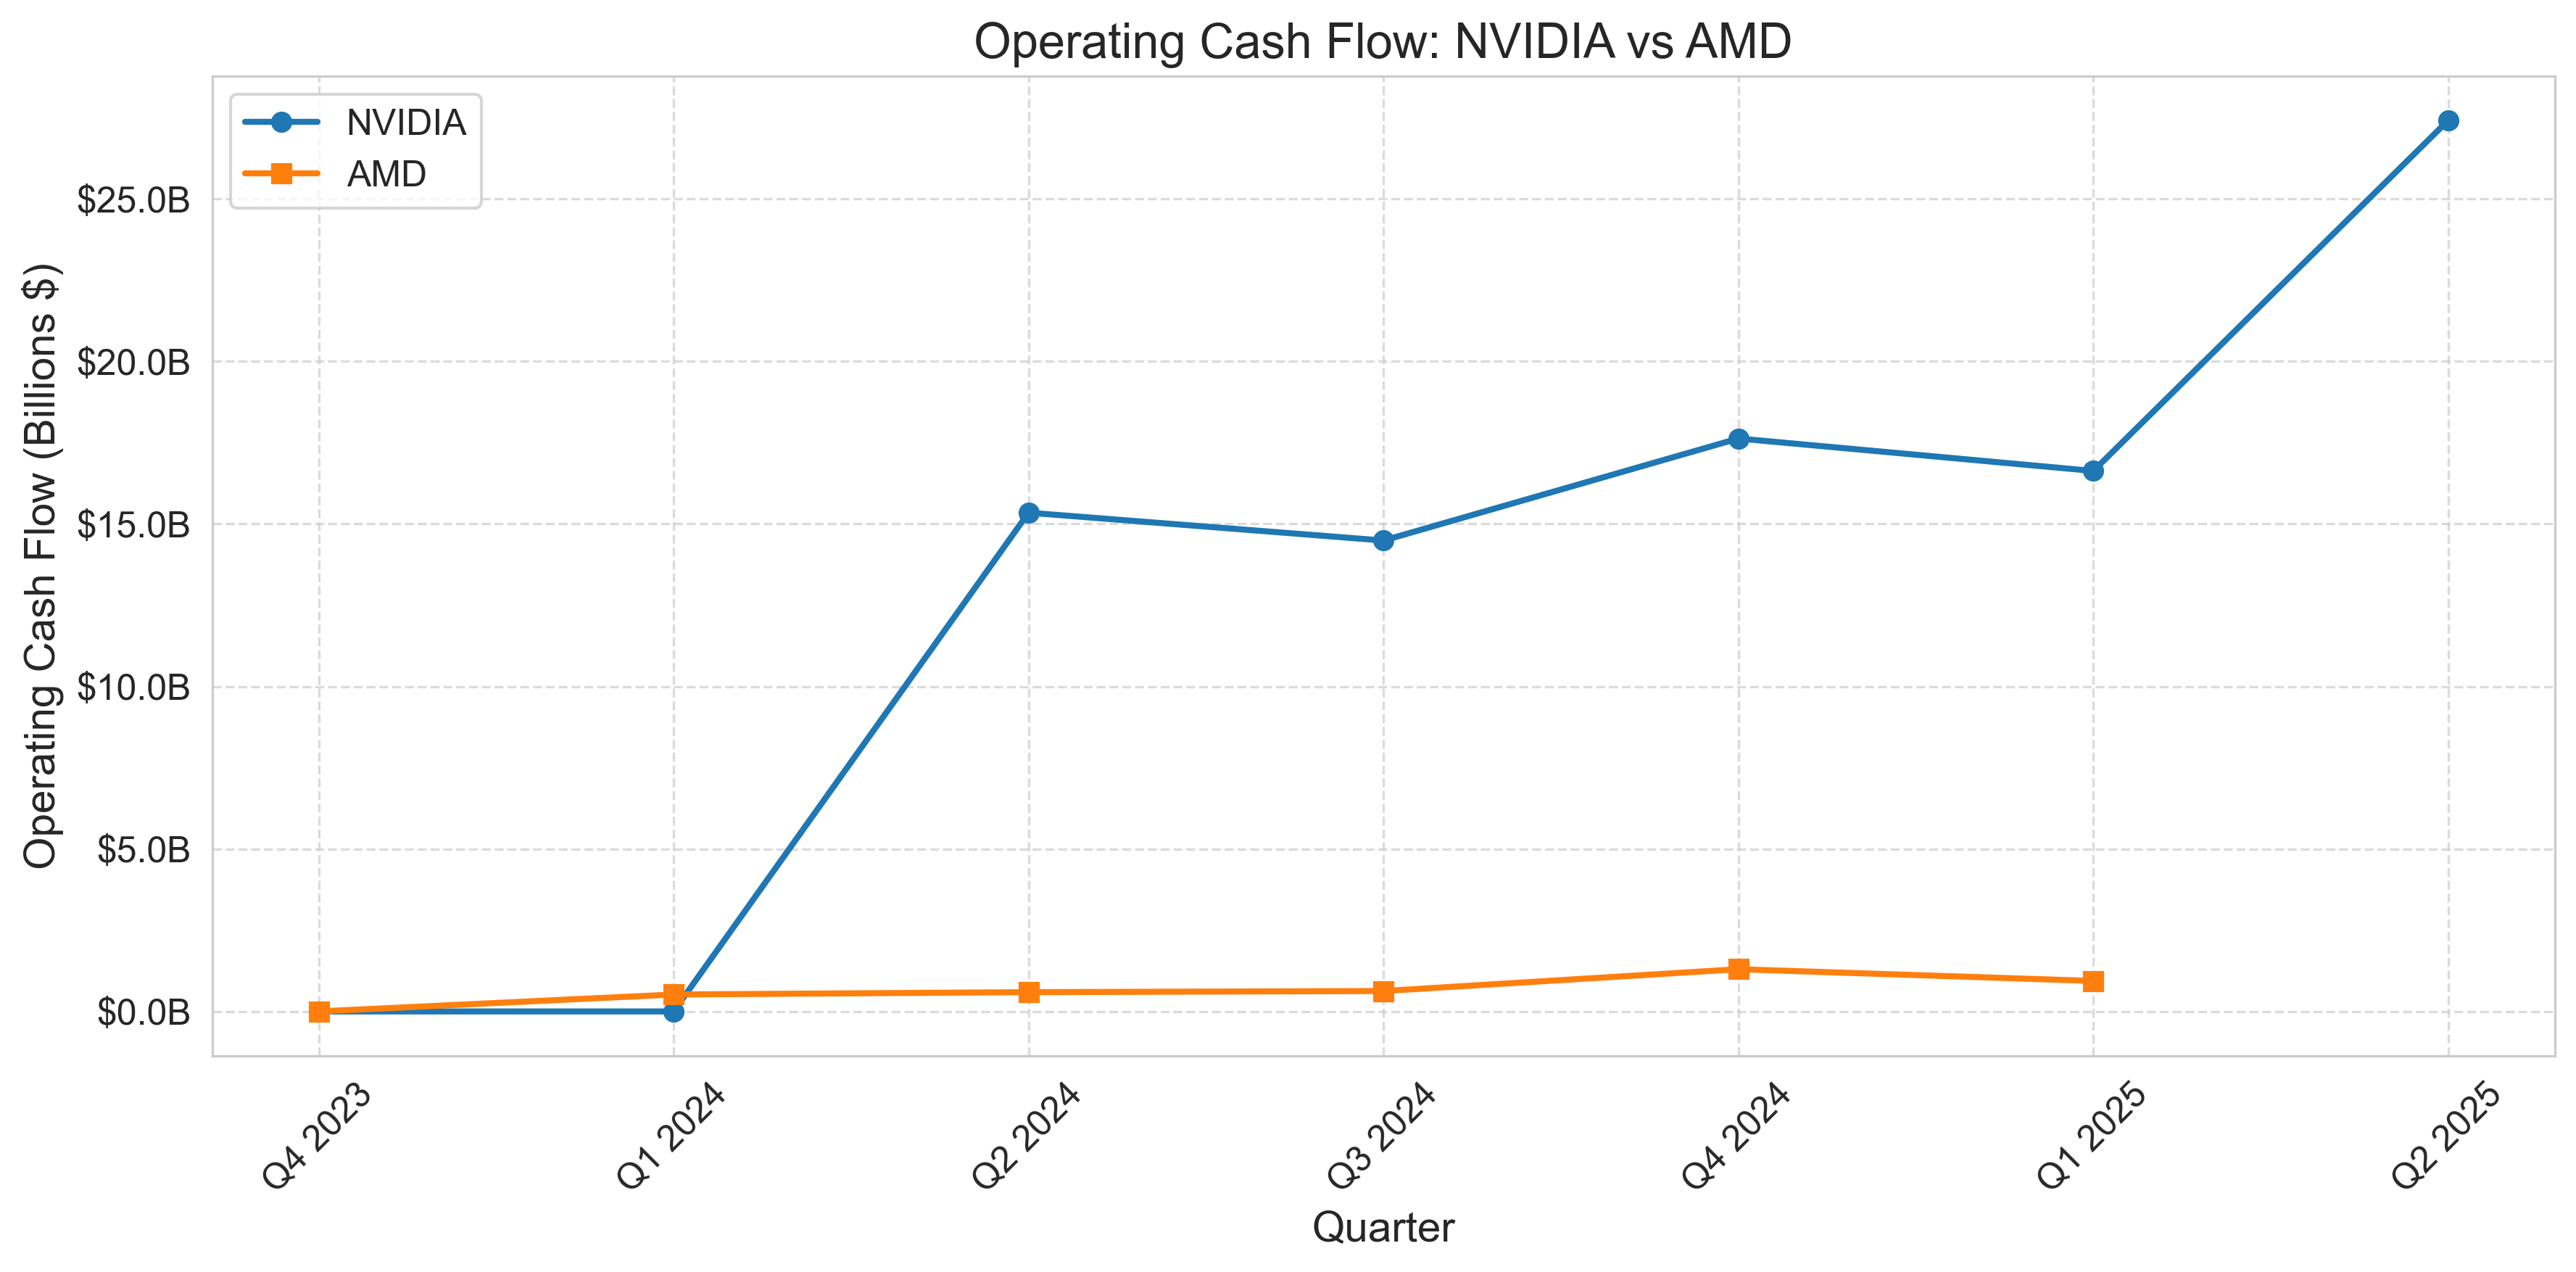
AMD reported $727 million in free cash flow for Q1 2025, with a cash position of $6.0 billion against $4.7 billion in debt, resulting in a net cash position of $1.3 billion. While AMD maintains a solid balance sheet, the scale difference in cash generation capability gives NVIDIA significantly more firepower for investments, acquisitions, and shareholder returns.
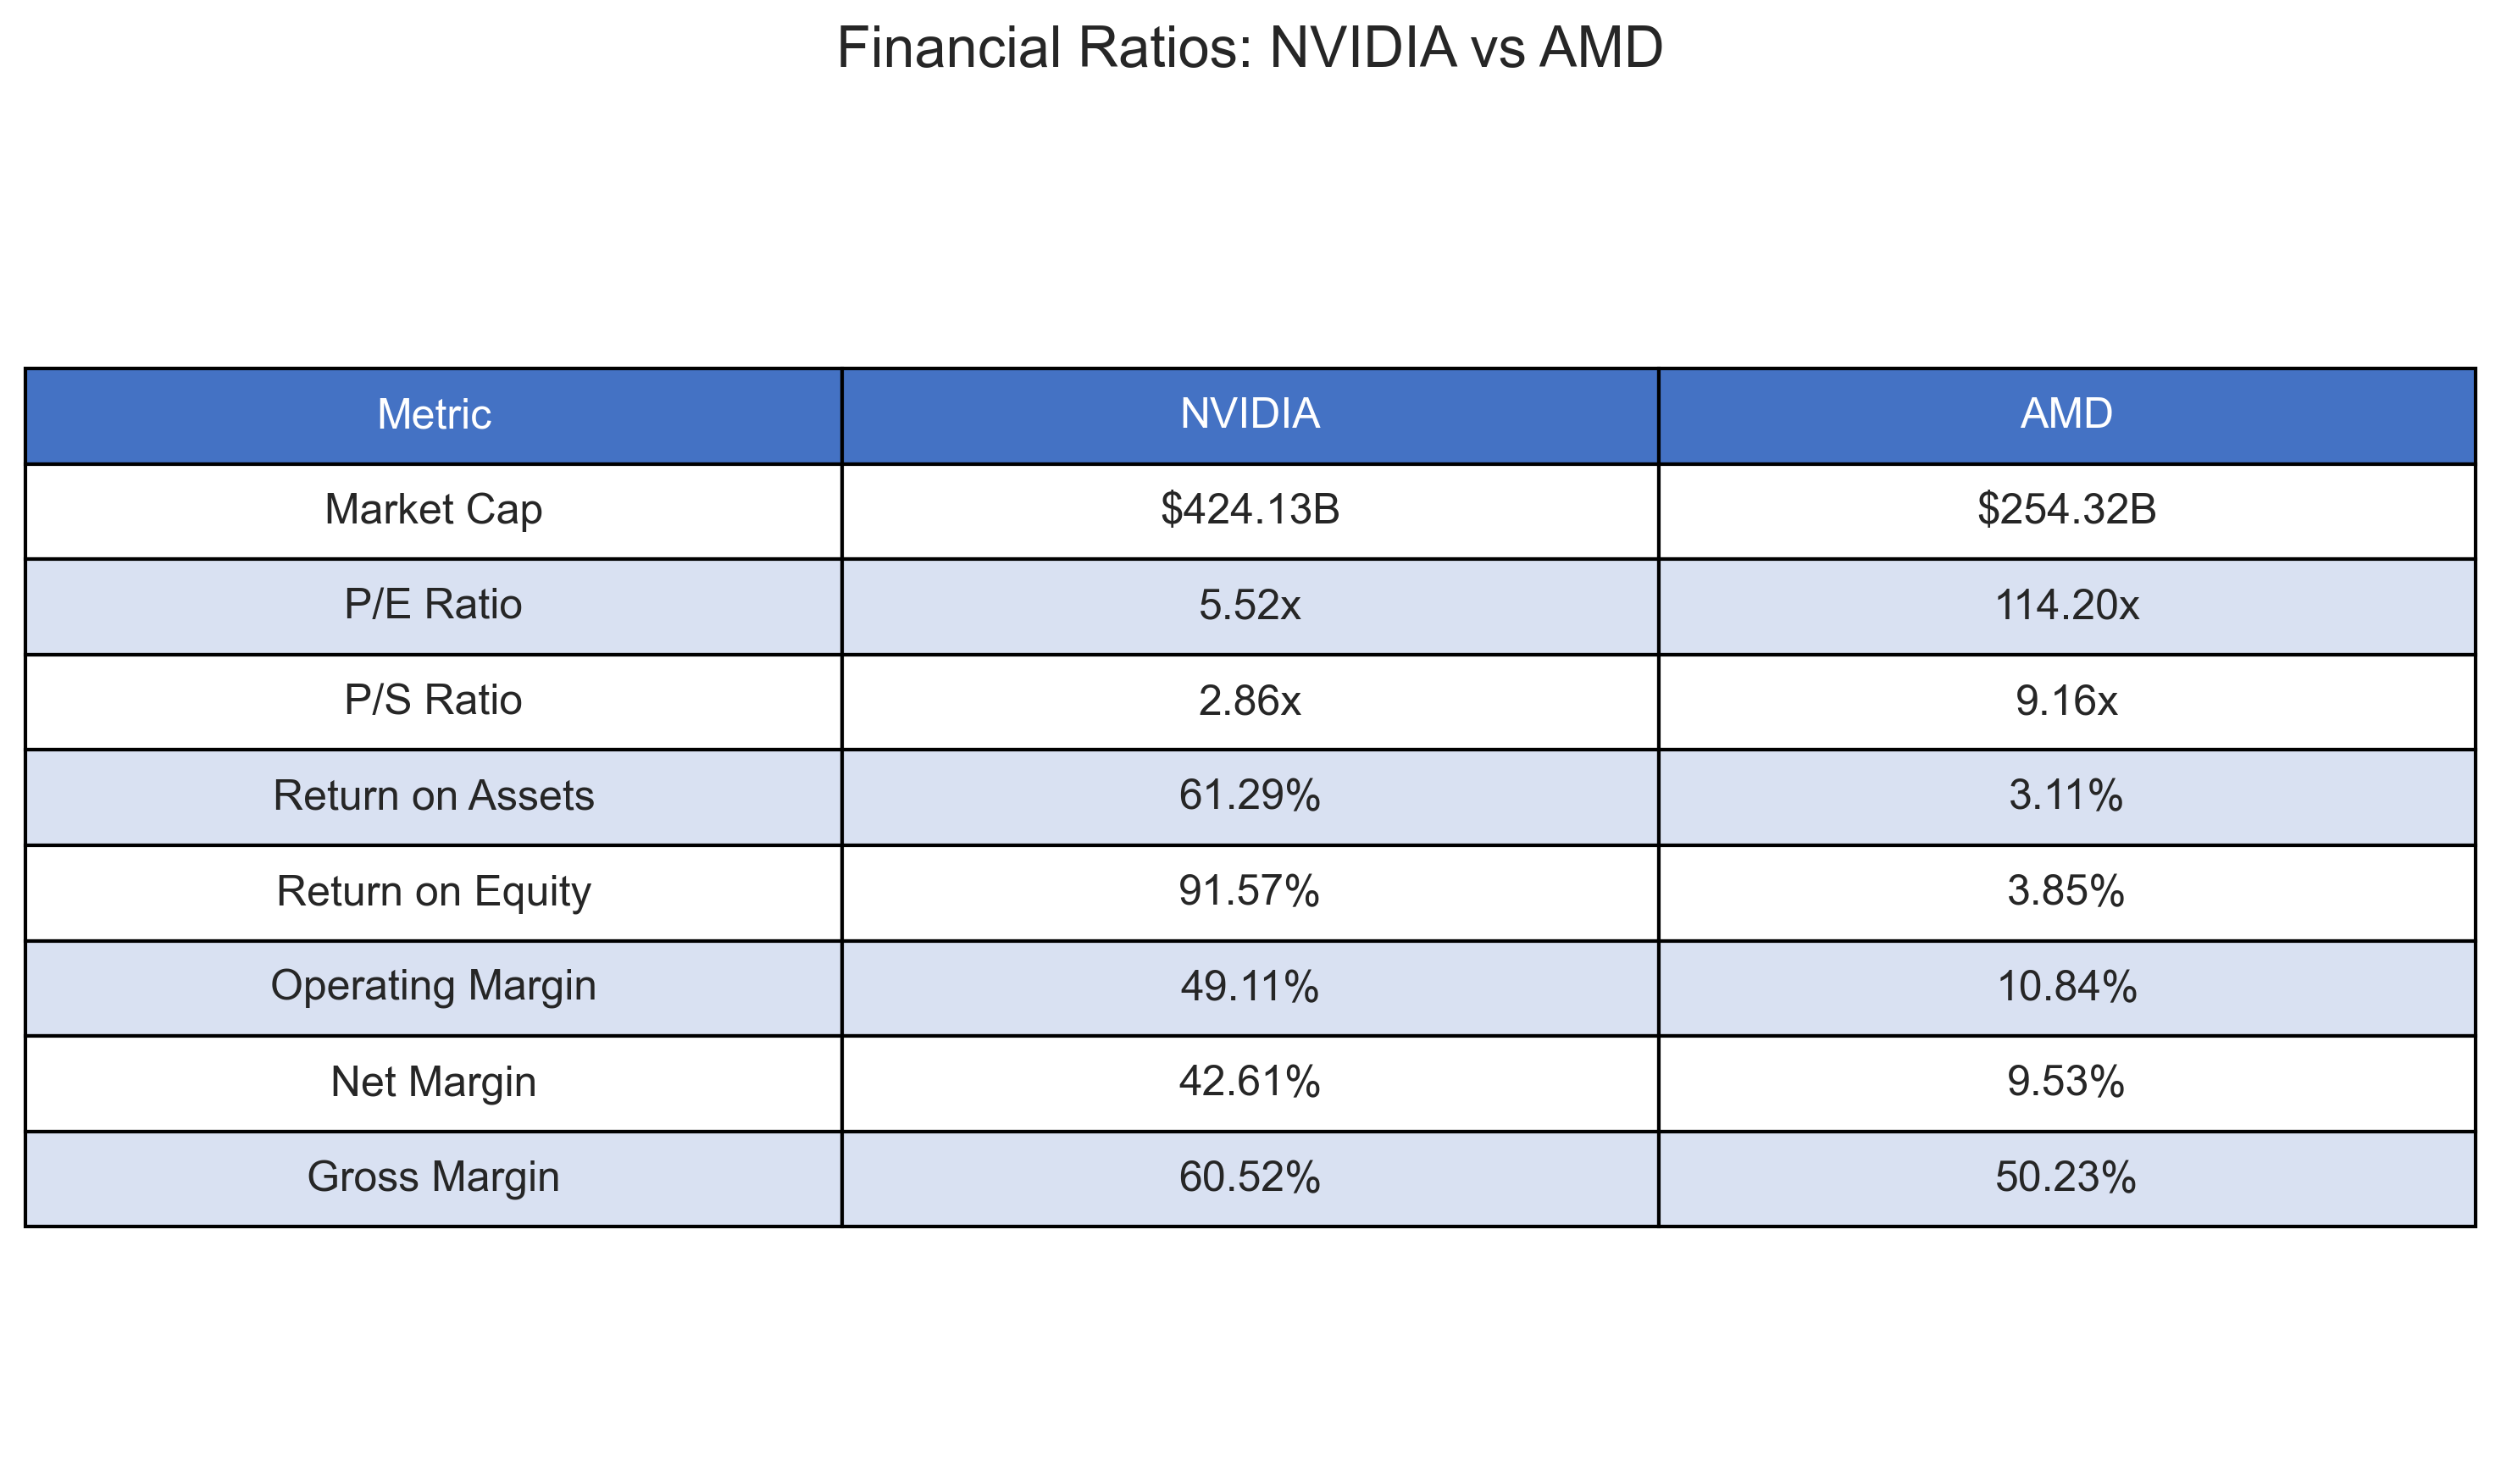
Market Valuation and Financial Ratios
The stock market continues to reward NVIDIA's extraordinary growth and profitability. With a market capitalization of approximately $424 billion, NVIDIA trades at a P/E ratio of 5.5x based on trailing twelve-month earnings. This surprisingly reasonable valuation reflects the market's expectations for continued strong performance. Meanwhile, AMD's $254 billion market cap translates to a much higher P/E ratio of 114.2x, indicating investors' expectations for substantial future profit growth as its AI strategy gains traction.
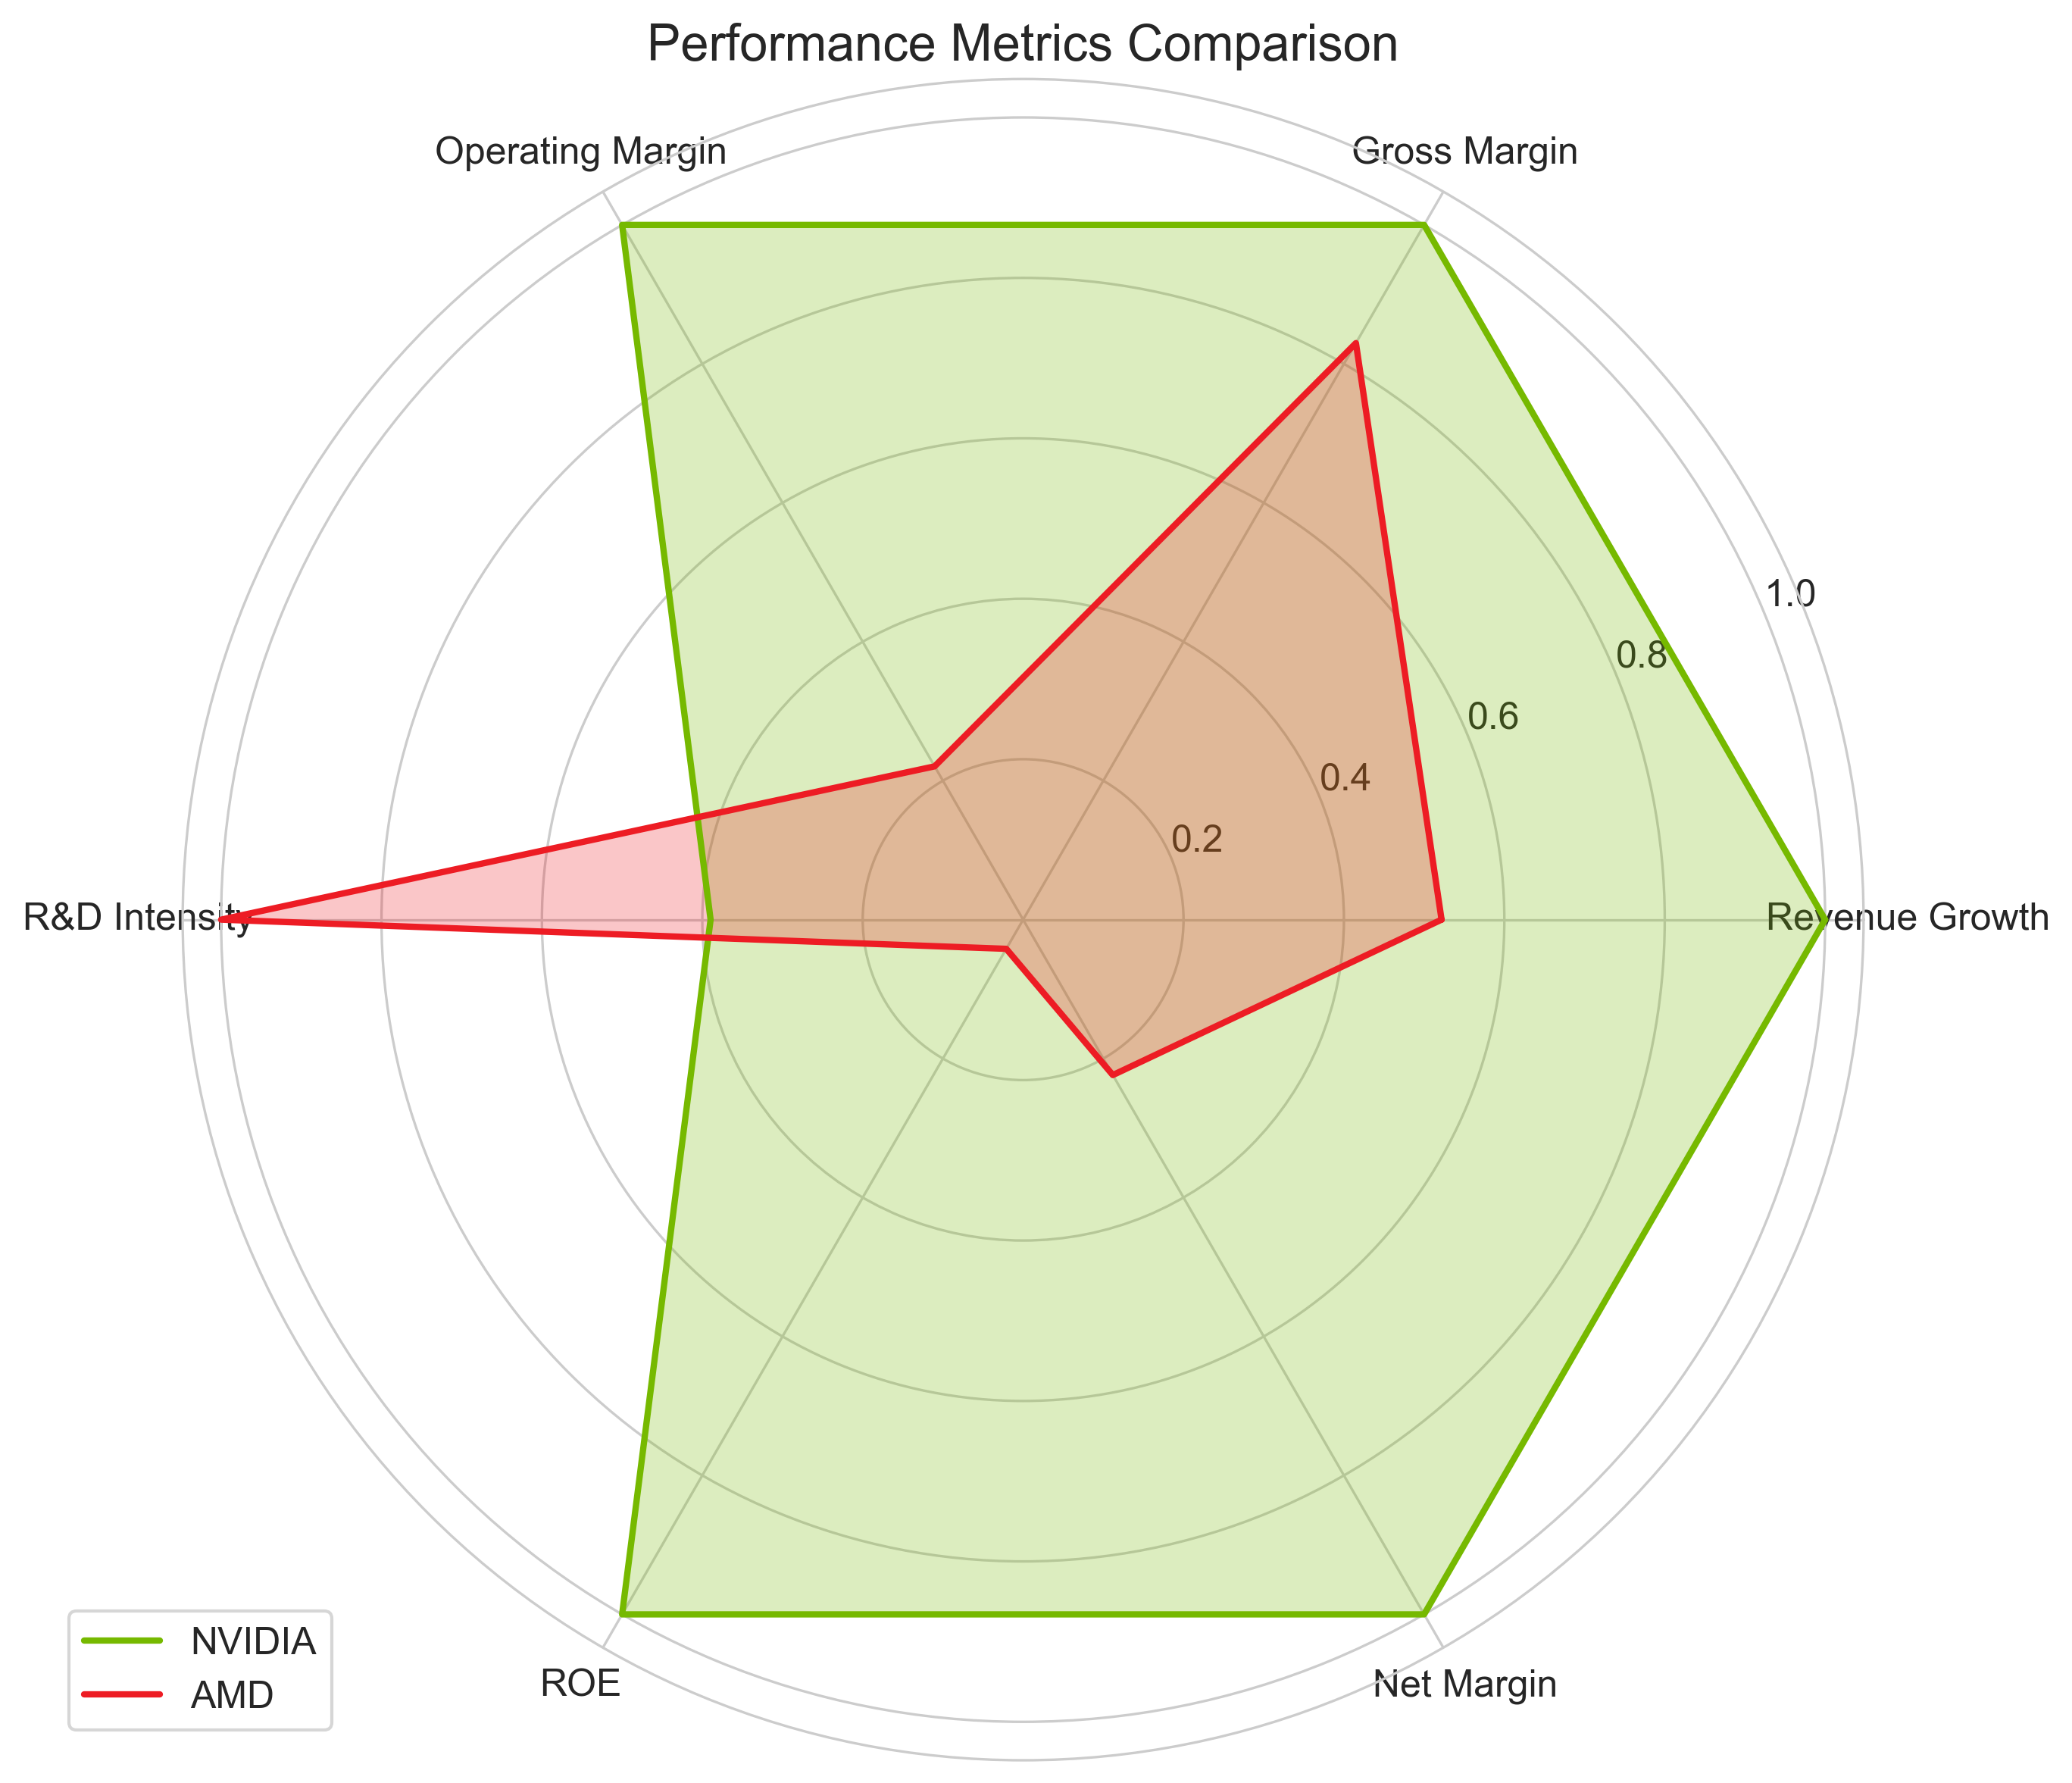
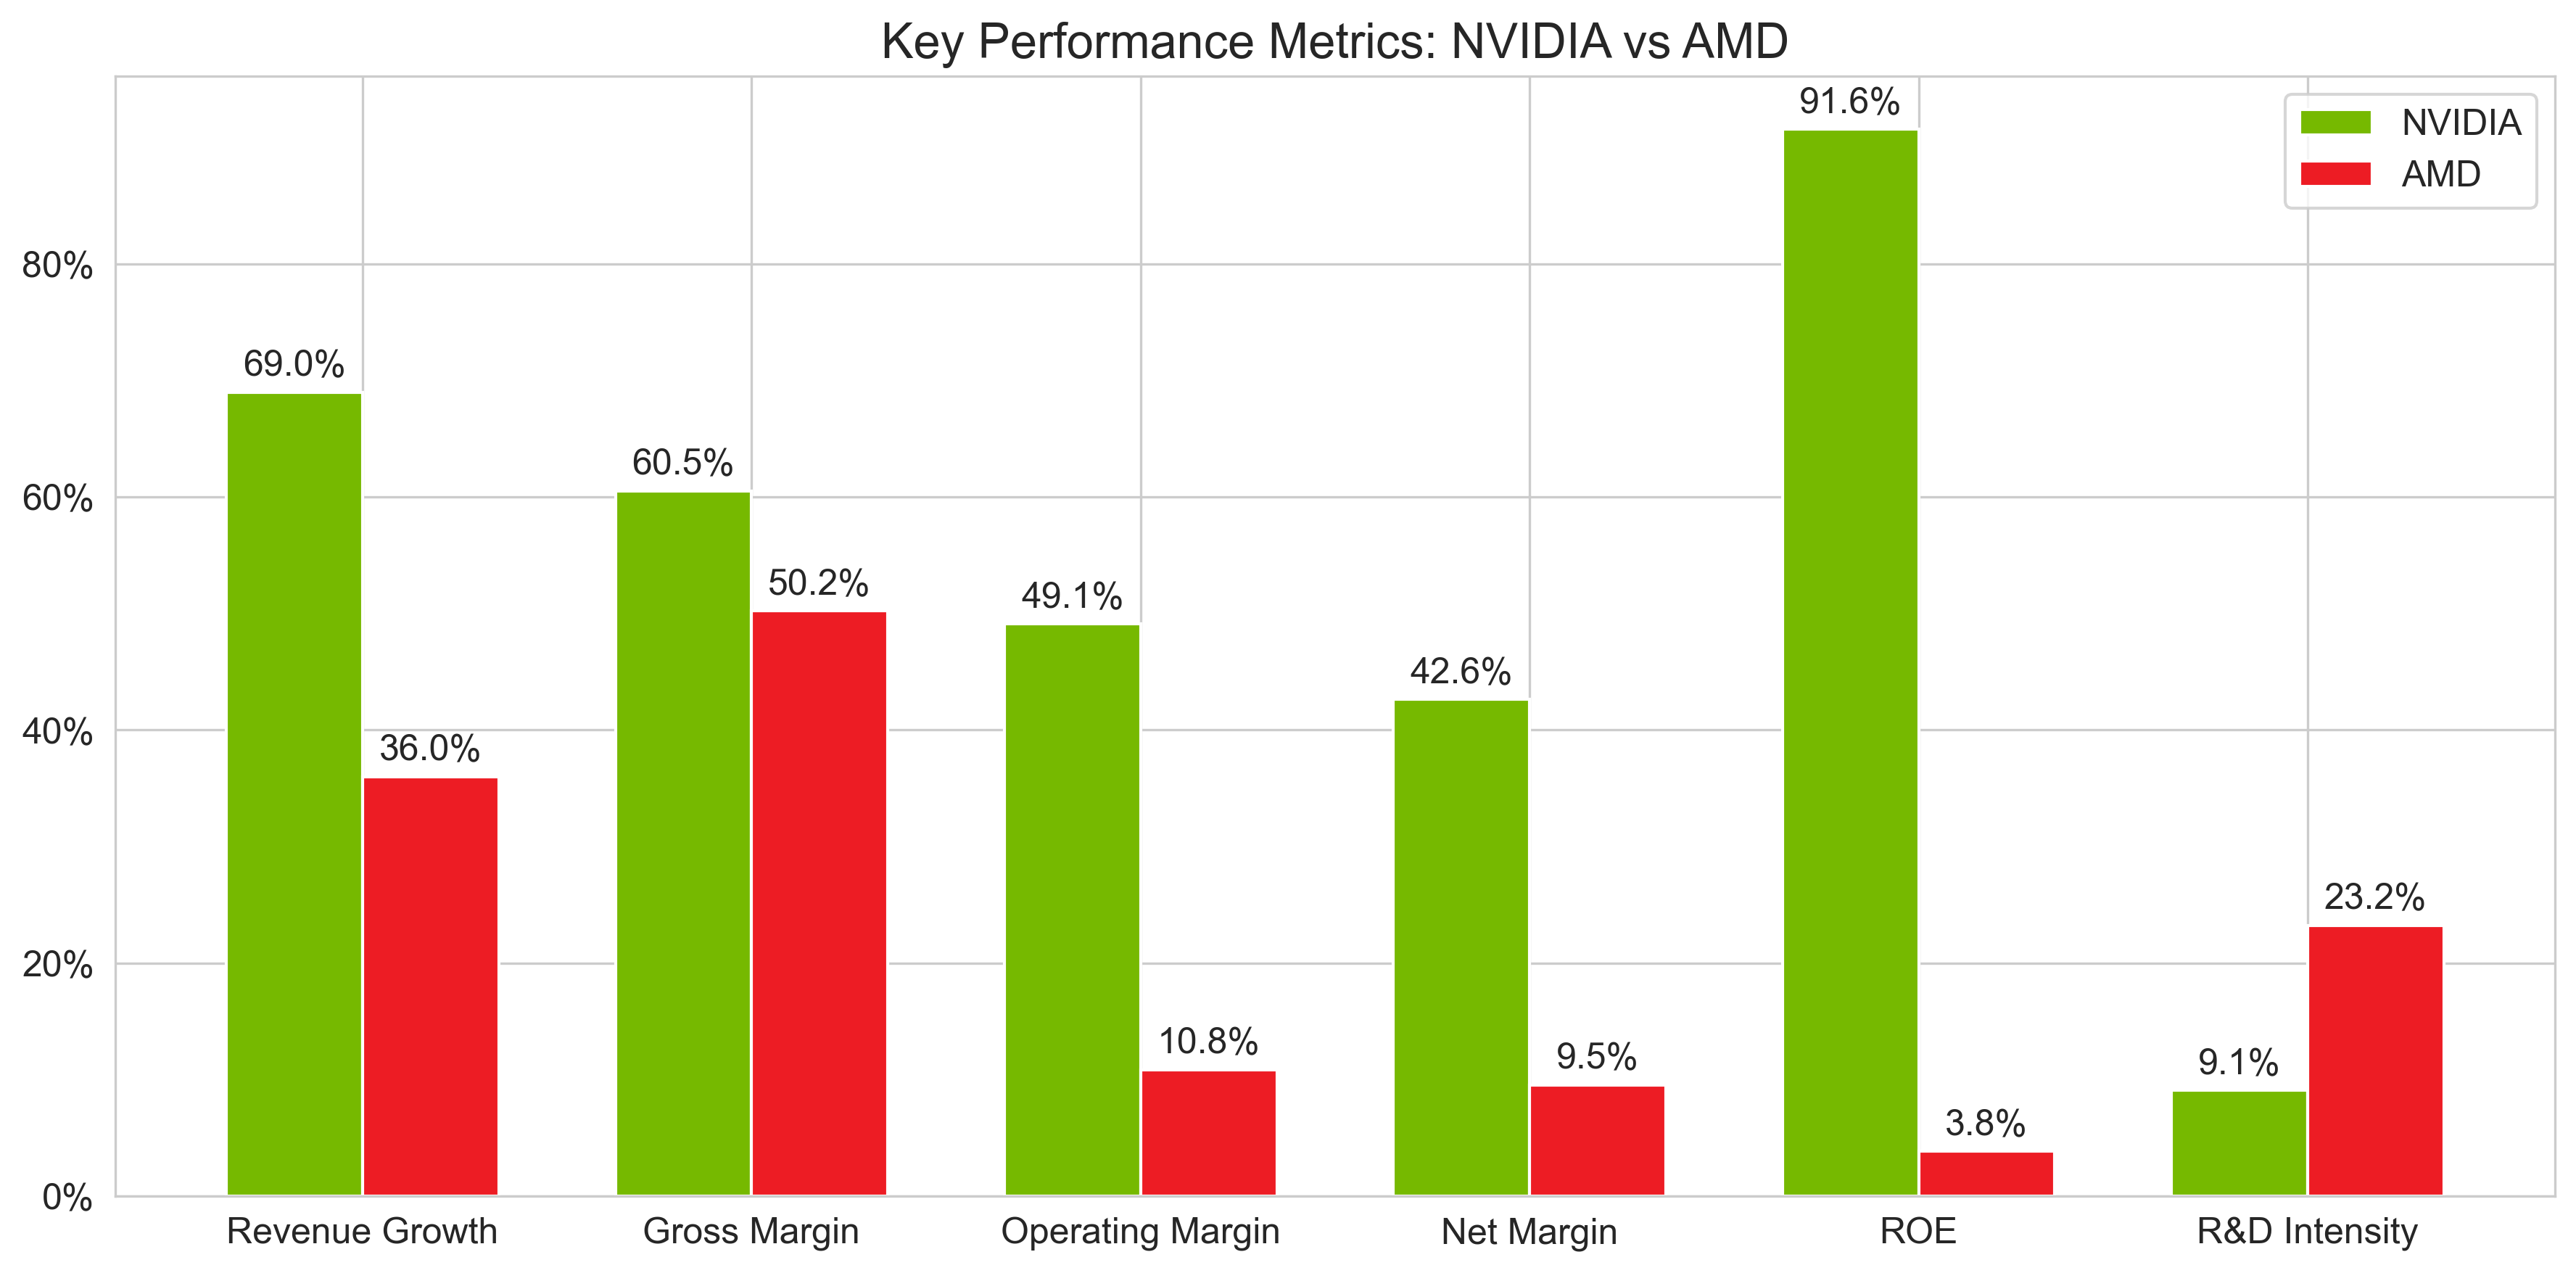
Performance Metrics Showdown
When examining the competitive positioning of these semiconductor titans across key performance indicators, NVIDIA demonstrates clear leadership in most financial metrics. The radar chart below visualizes the relative performance across six critical dimensions, with NVIDIA showing particular strength in profitability metrics and revenue growth, while AMD leads in R&D intensity as a percentage of revenue.
Market Context and Industry Dynamics
The semiconductor industry continues to experience strong demand driven by AI infrastructure development, though geographic dynamics are shifting. NVIDIA reported that quarterly revenue in China reached approximately $5.4-5.5 billion in Q2 2025 despite export restrictions, demonstrating the global nature of chip demand. AMD has been more cautious about its China exposure but has also navigated the geopolitical constraints while maintaining growth.
As both companies move into the second half of 2025, analysts are closely watching whether AI chip demand will maintain its current trajectory or whether we'll see normalization in order patterns from major hyperscalers and enterprise customers. NVIDIA's CEO Jensen Huang has consistently emphasized that we are still in the early stages of the AI revolution, suggesting runway for continued growth.
Key Takeaways
- NVIDIA maintains a commanding position in the AI chip market with superior revenue growth (69% YoY) and industry-leading profitability metrics
- AMD is executing well on its AI strategy with 36% YoY growth and improving gross margins that have reached 50%
- The gap in R&D spending is substantial in absolute dollars ($4.0B vs $1.7B quarterly), though AMD is investing a higher percentage of its revenue in R&D (23% vs 9%)
- NVIDIA's cash generation capability ($26.2B quarterly FCF) provides significant strategic flexibility compared to AMD ($727M quarterly FCF)
- Both companies maintain strong balance sheets with net cash positions, positioning them well to weather potential market volatility
- Market valuations suggest investors expect NVIDIA to sustain its leadership position while anticipating significant profit growth from AMD in the coming years
The competitive dynamics between these semiconductor titans offer a window into broader technological shifts and market opportunities as AI implementation continues to accelerate across industries. While NVIDIA currently enjoys a commanding position in the AI chip market, AMD's strategic investments and improving performance metrics suggest the competitive landscape will remain dynamic as we progress through 2025 and beyond.
Comments (0)
No comments yet. Be the first to comment!