Introduction – Why We Chase the Crowd
Have you ever felt the urge to buy a skyrocketing stock because "everyone else is doing it"? Or panic-sold during a market dip to avoid further losses? This herd behavior—following the crowd—is deeply ingrained in investor psychology. But is it always a mistake? In this blog, we put this question to the test with real data. We've simulated a "volume-based herd behavior" strategy against the classic buy-and-hold approach using five popular stocks from 2019–2024: Tesla, Apple, NVIDIA, AMC, and Palantir. The results might challenge conventional wisdom about the "right way" to invest.
What Is Herd Behavior in the Stock Market?
Herd behavior in investing is exactly what it sounds like – investors moving together like a herd, either charging toward an opportunity or fleeing from danger. It manifests in two ways: FOMO during bull runs and panic selling during crashes.
When a stock climbs rapidly, social media lights up, news intensifies, and everyone wants in. Conversely, when markets tumble, fear spreads, triggering mass selloffs.
Trading volume provides a measurable footprint of this behavior. When volume spikes above normal levels, it signals that emotional decision-making is driving the market. Our strategy aims to detect these moments and use them as trading signals.
Our Two Strategies — Simple Rules, Real Data
We tested two distinctly different approaches to investing in our five target stocks, using actual market data from January 2019 through early 2024. Both strategies received the same monthly cash infusion of $100 per stock, but they differed dramatically in how they responded to market movements. The buy-and-hold approach represents the disciplined, long-term investor who ignores short-term fluctuations, while the volume-based herd strategy embodies the more reactive, sentiment-driven trader who attempts to capitalize on market momentum and avoid downturns.
Buy and Hold Strategy
- Invest $100 into each stock on the first trading day of every month
- Never sell, regardless of market conditions or price movements
- Remain fully invested throughout the entire period
This strategy embodies the philosophy popularized by investors like Warren Buffett – patient capital allocation with a long-term horizon, ignoring short-term market noise.
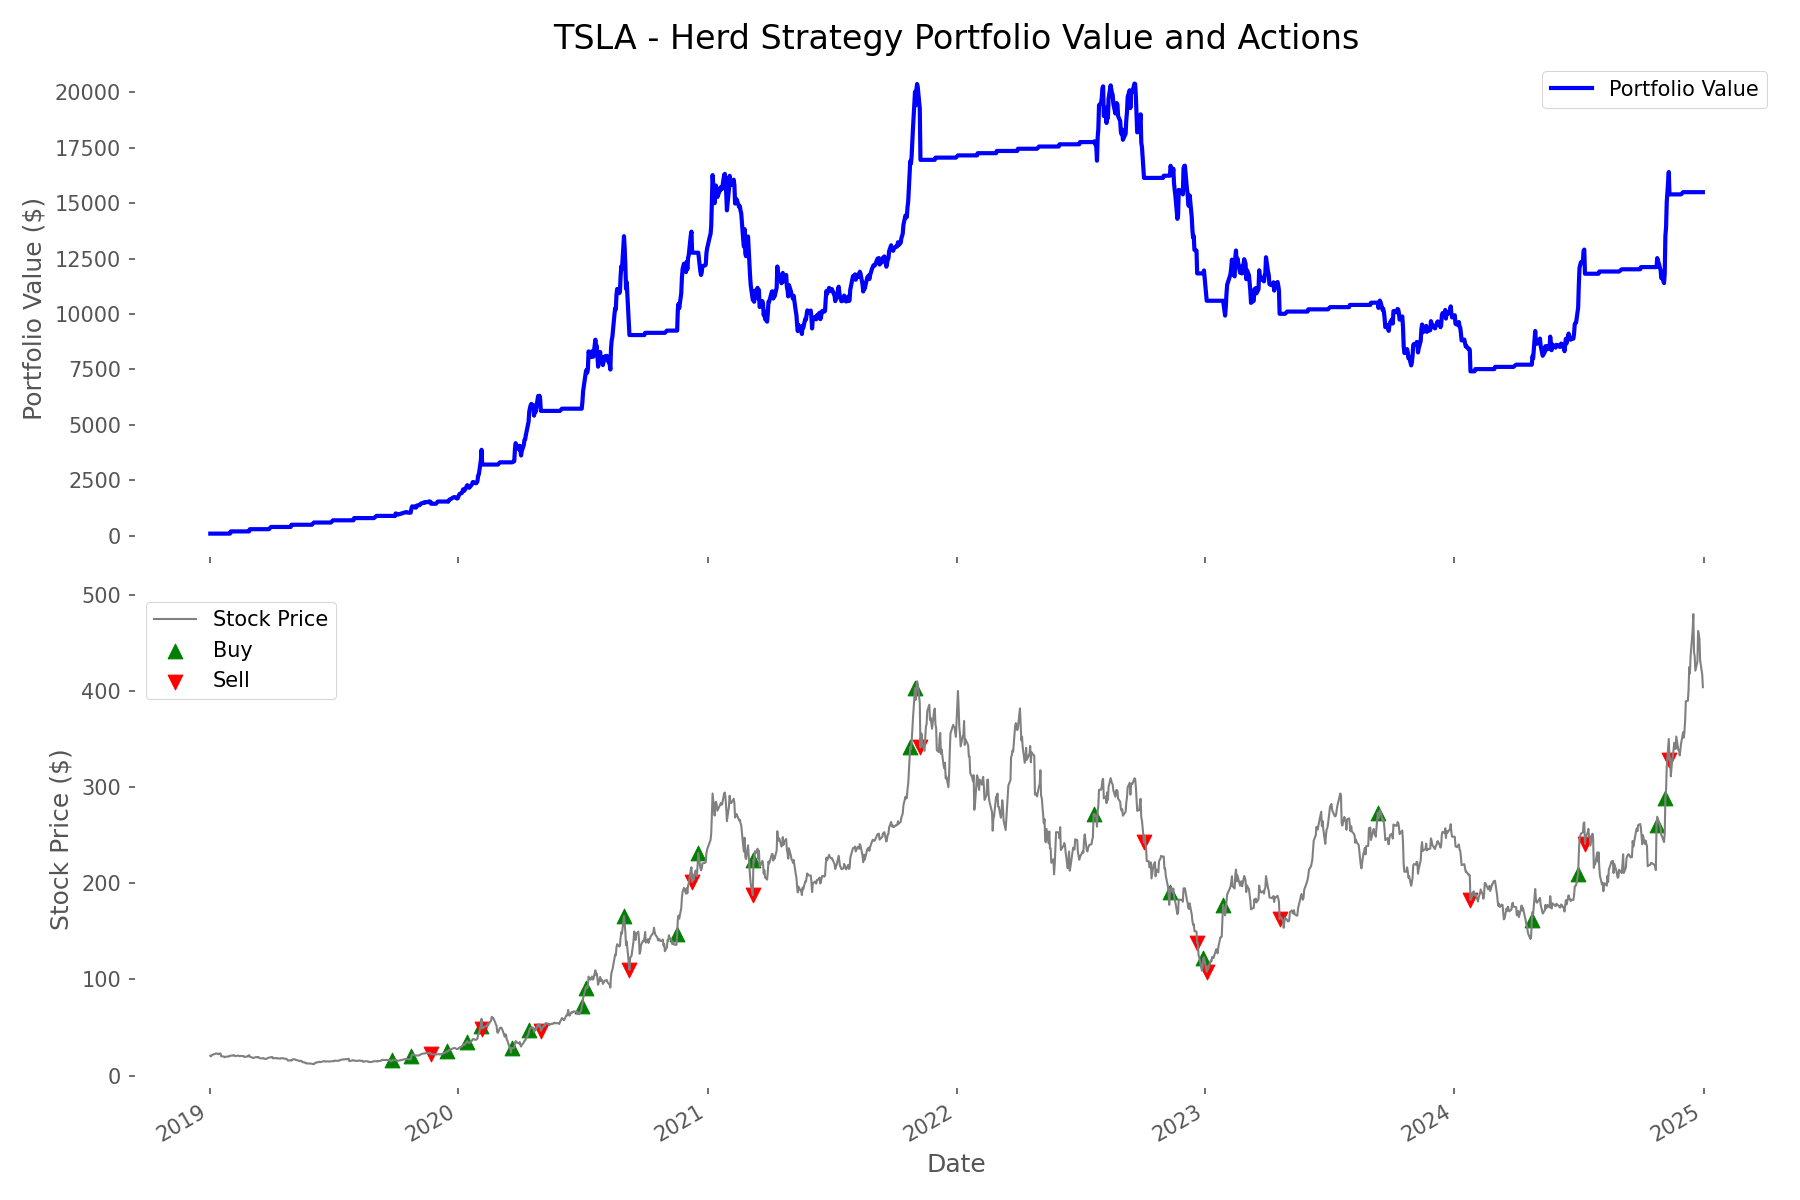
Volume-Based Herd Strategy
- Calculate each stock's 30-day average trading volume
- When today's volume exceeds 1.5× the average (signaling unusual activity):
- If price rises more than 5% → Buy with all available cash (following positive momentum)
- If price drops more than 5% → Sell all holdings (avoiding further losses)
- Otherwise, hold current position
- Add $100 cash on the first trading day of each month (same as buy-and-hold)
This strategy attempts to ride the wave of market sentiment – buying when enthusiasm peaks and selling when fear takes over, but only when confirmed by abnormally high trading volume.
Behind the Scenes – Step-by-Step Simulation Logic
To ensure our comparison was fair and realistic, we implemented a detailed simulation framework that tracked every aspect of both strategies. This wasn't just a theoretical exercise – we used actual historical price and volume data for each trading day, accounting for every buy, every sell, and every dollar invested.
- For each stock (TSLA, AAPL, NVDA, AMC, PLTR), we started with $0 cash and 0 shares in January 2019
- On each trading day, we:
- Added $100 cash if it was the first trading day of the month
- Calculated the 30-day moving average of trading volume
- For the herd strategy, checked if volume exceeded 1.5× the average:
- If price rose >5%, we bought shares with all available cash
- If price dropped >5%, we sold all shares
- Tracked daily cash balance, shares held, stock price, and total portfolio value
One critical aspect of our simulation was its treatment of fractional shares. Rather than limiting purchases to whole shares (which would have left cash uninvested), we allowed for fractional share purchases to ensure that all available cash was deployed according to each strategy's rules. This approach mirrors the capabilities of modern brokerages that offer fractional share trading, making our simulation more relevant to today's retail investors.
This meticulous tracking allowed us to compare not just the final outcomes, but also how each strategy performed through different market conditions – bull runs, corrections, and everything in between.
Results – Who Came Out Ahead?
After running our simulation across five years of market data, the results revealed fascinating patterns that challenge the one-size-fits-all approach to investing. We analyzed not just the final portfolio values, but also risk metrics like maximum drawdown, volatility, and risk-adjusted returns (Sharpe ratio). This comprehensive analysis provides a nuanced view of how each strategy performed across different market conditions and stock types.
Overall Performance: It Depends on the Stock
The most striking finding was how strategy performance varied dramatically by stock type:
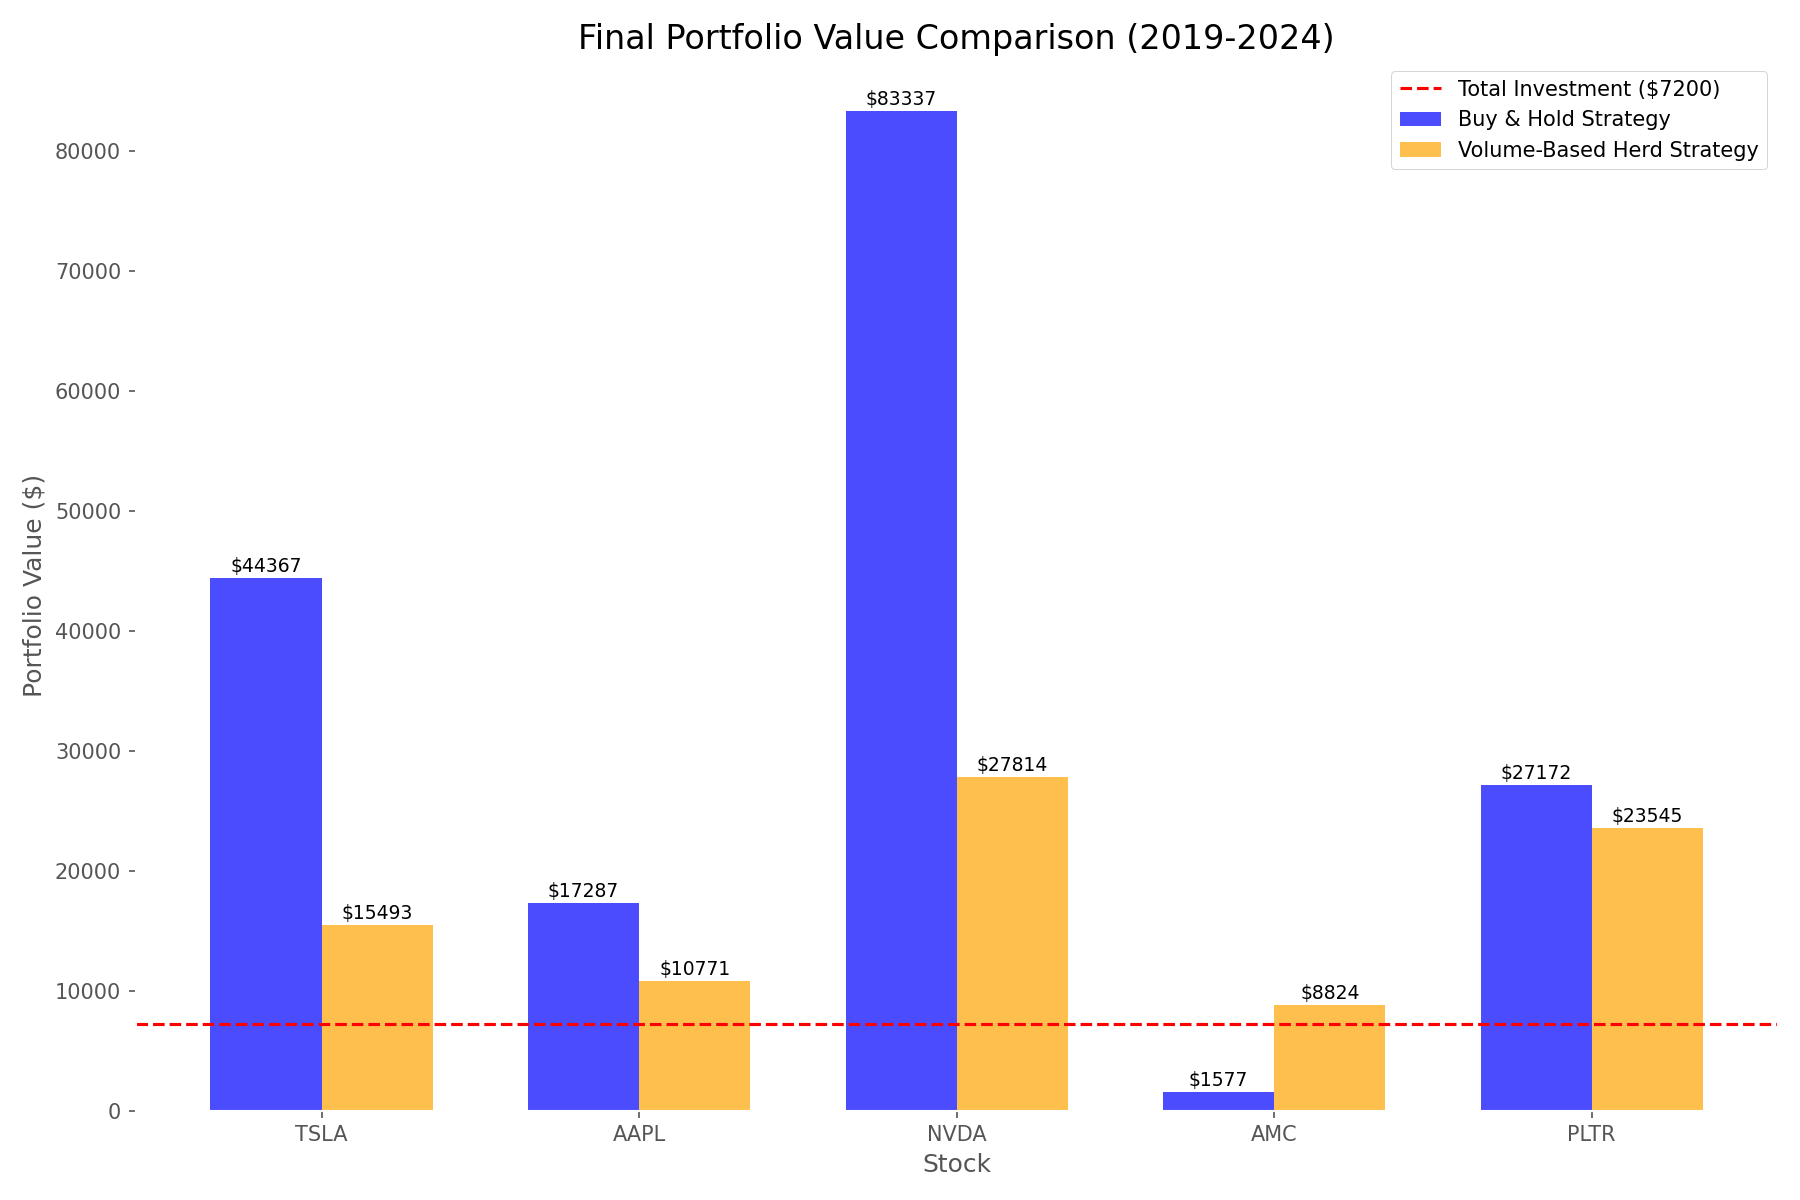
- For established growth stocks (TSLA, AAPL, NVDA), buy-and-hold was the clear winner
- For more volatile stocks (AMC, PLTR), the herd strategy significantly outperformed
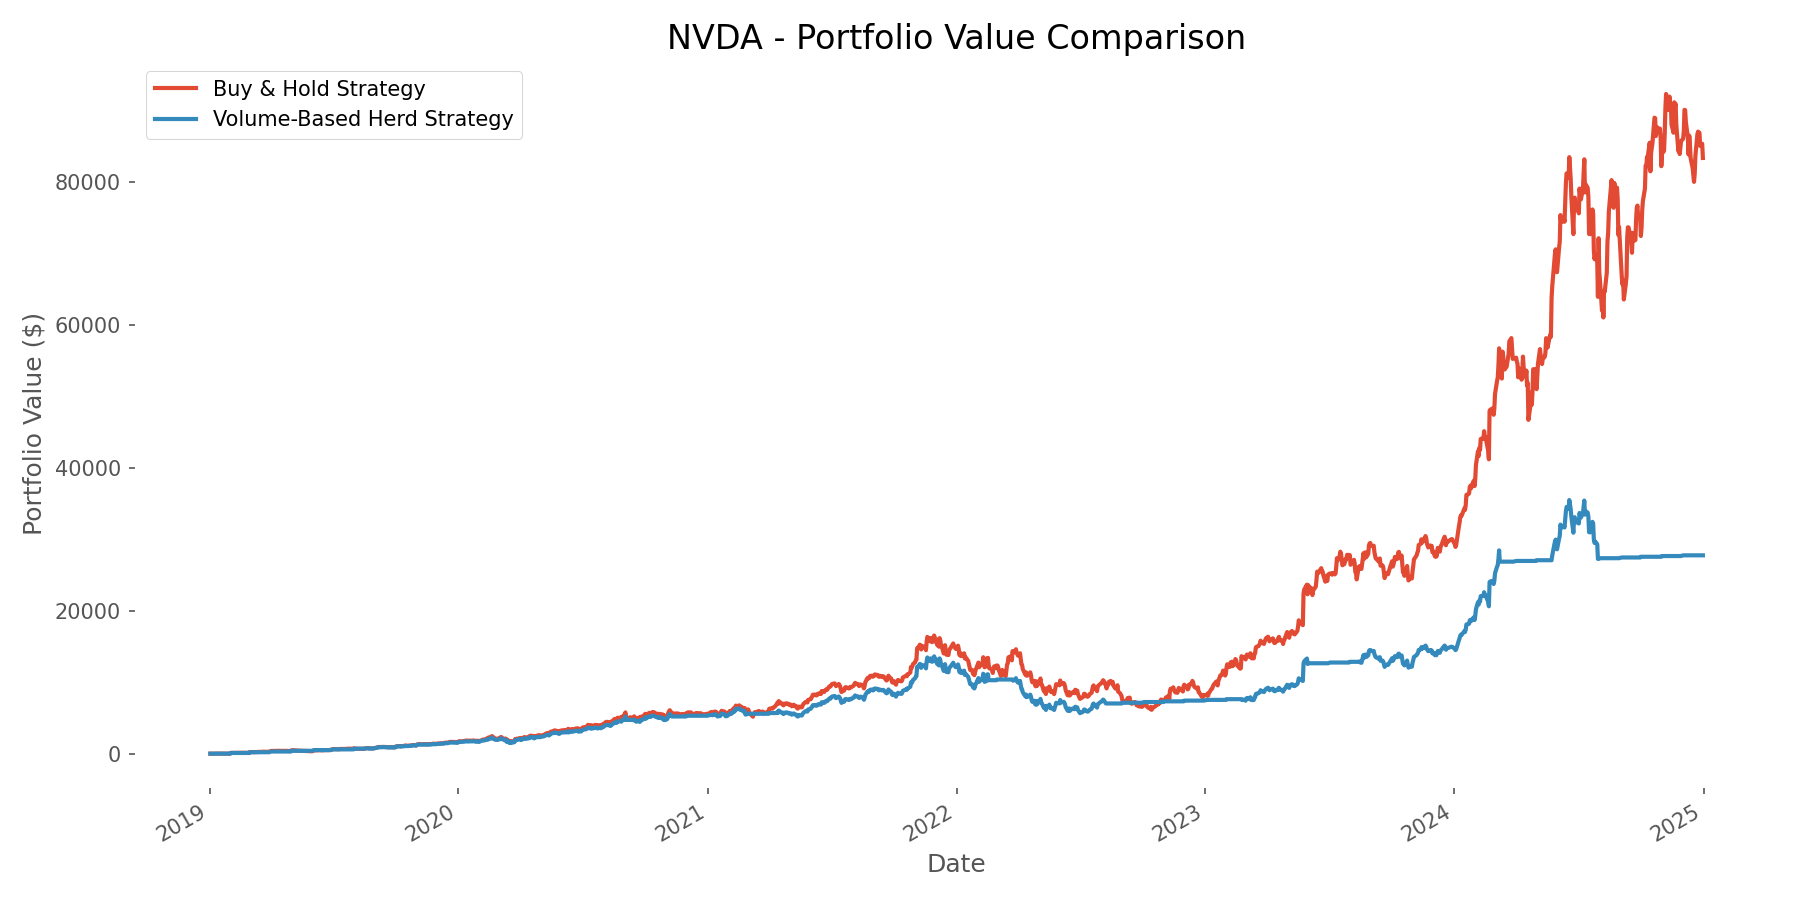
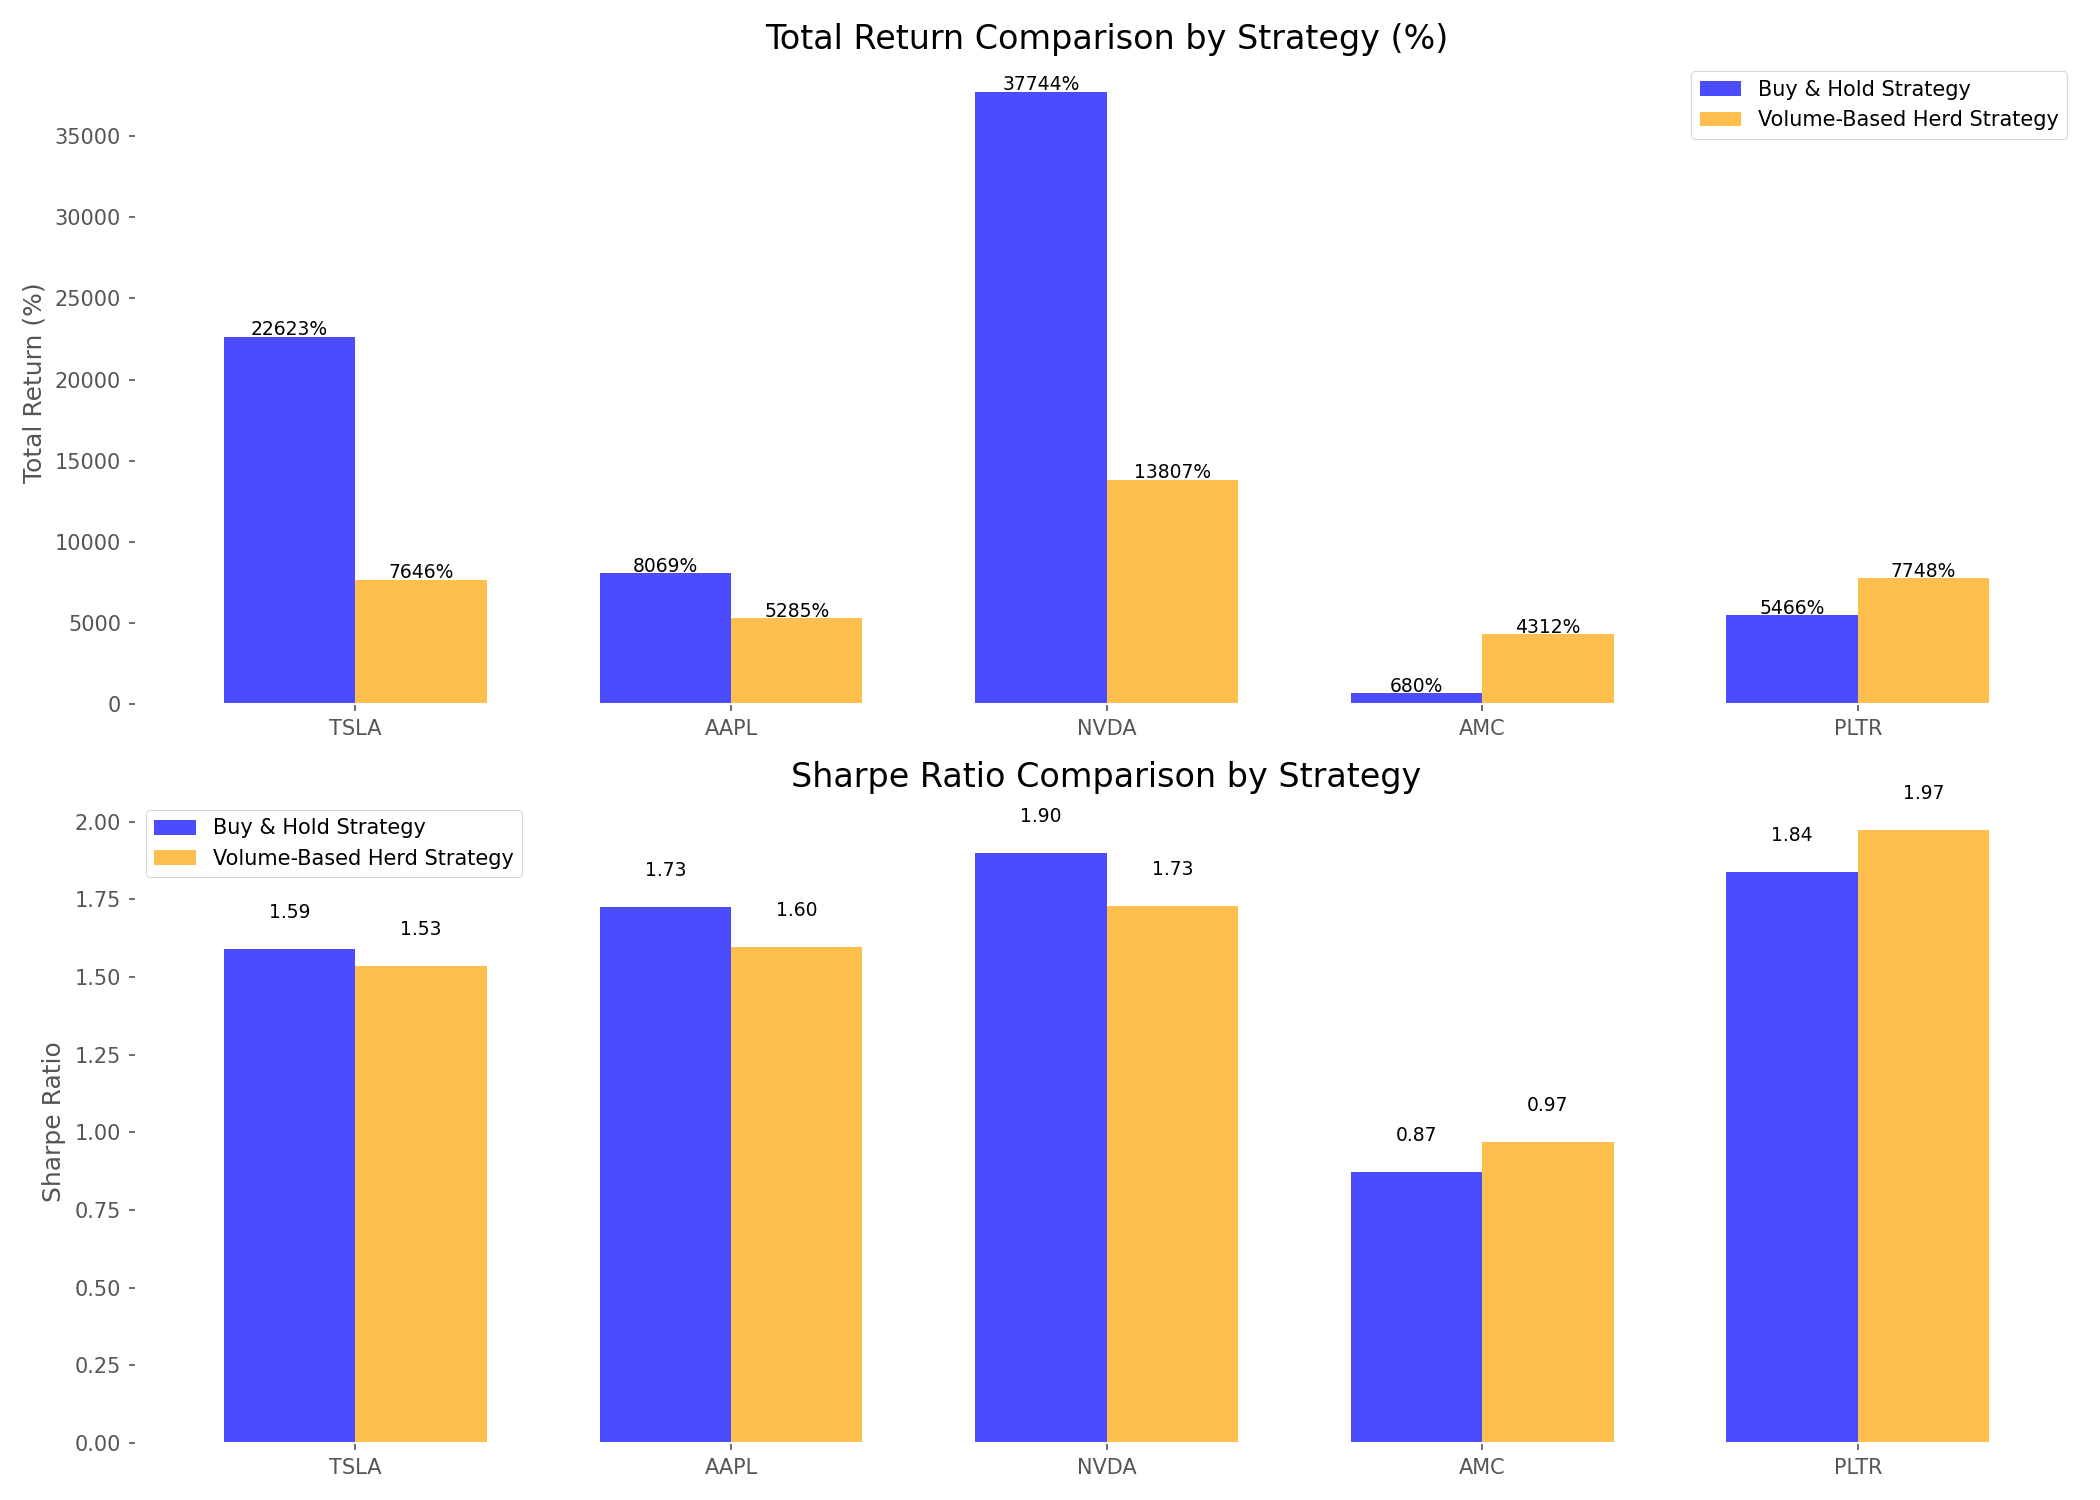
- NVIDIA delivered the most spectacular returns under buy-and-hold, turning $7,200 ($100/month for 72 months) into over $83,000 – a 37,743% return
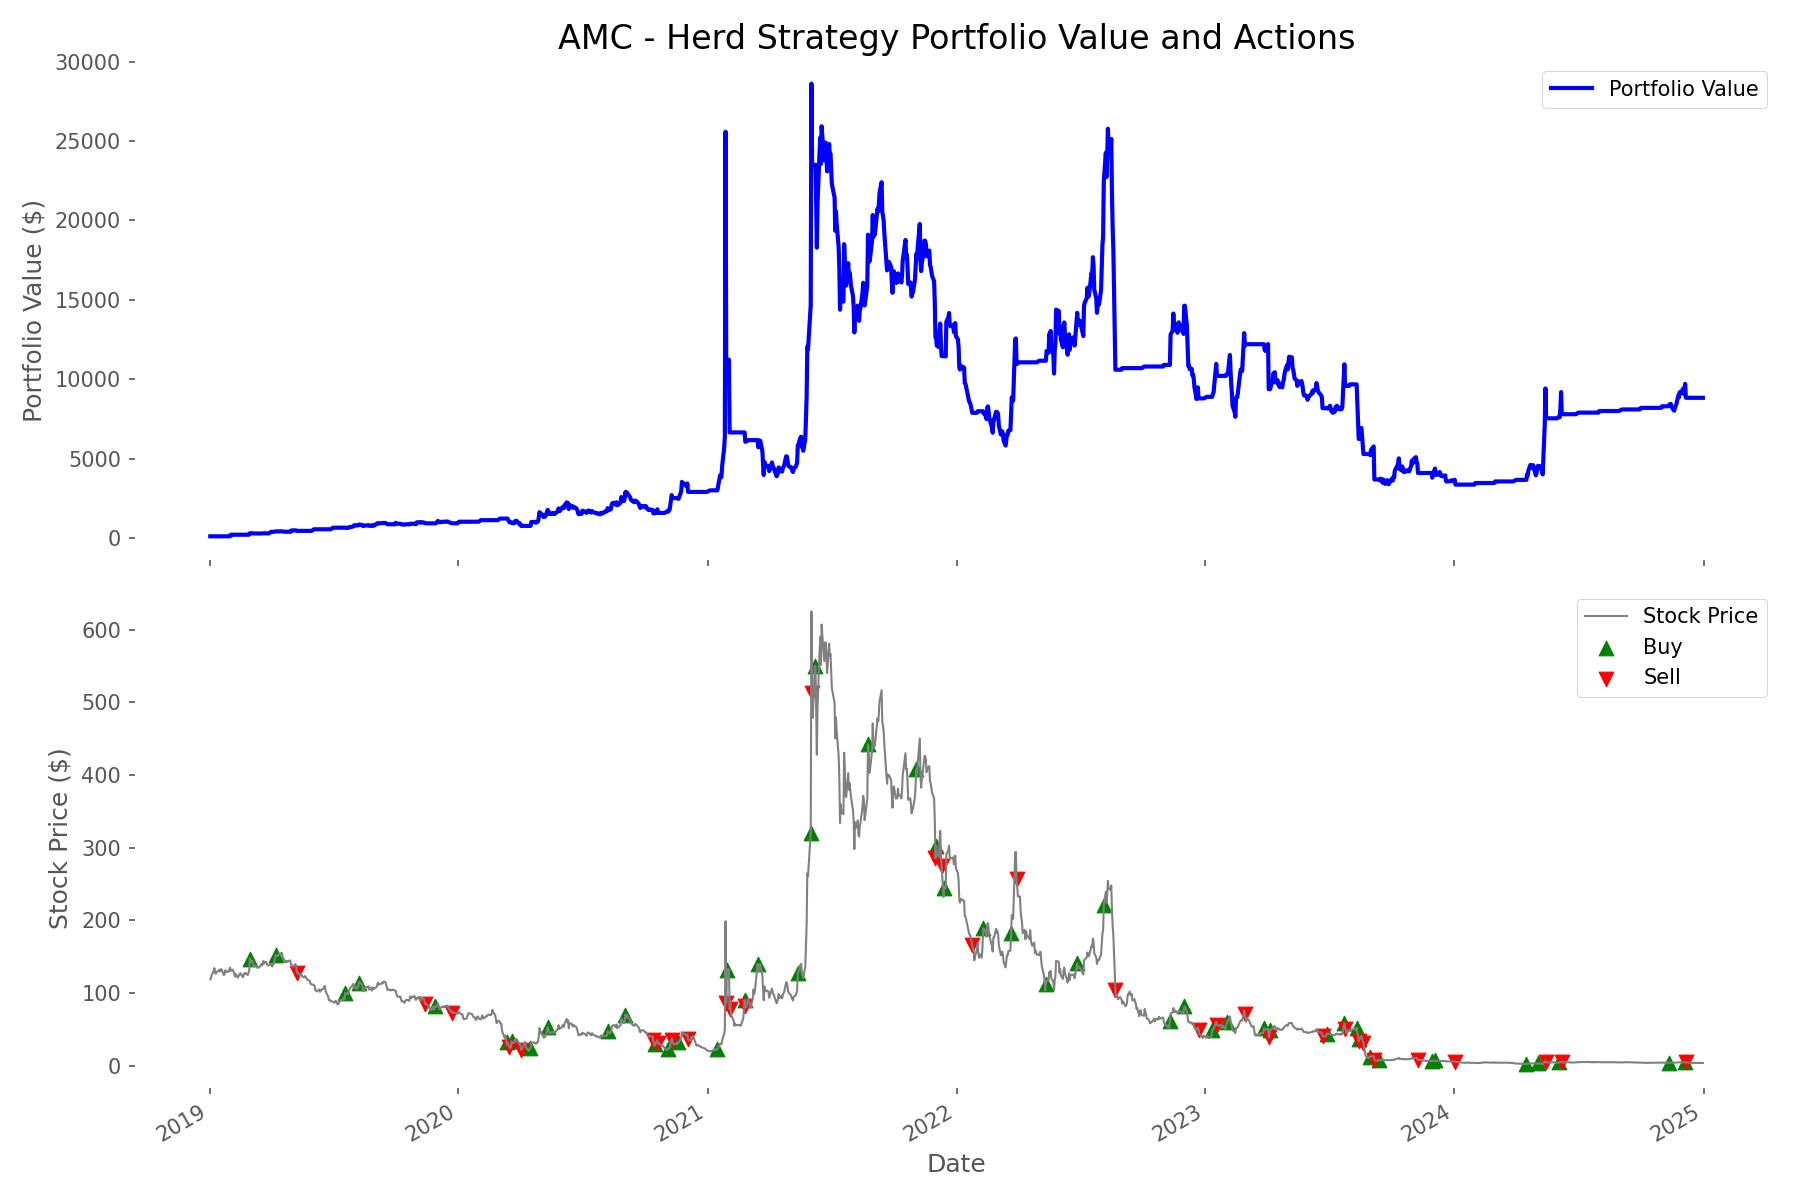
- AMC showed the most dramatic difference between strategies – buy-and-hold returned 680%, while the herd strategy delivered 4,312%
Risk Management: Herd Strategy Provided Better Protection
When we examined drawdowns (peak-to-trough declines), the herd strategy demonstrated superior risk management:
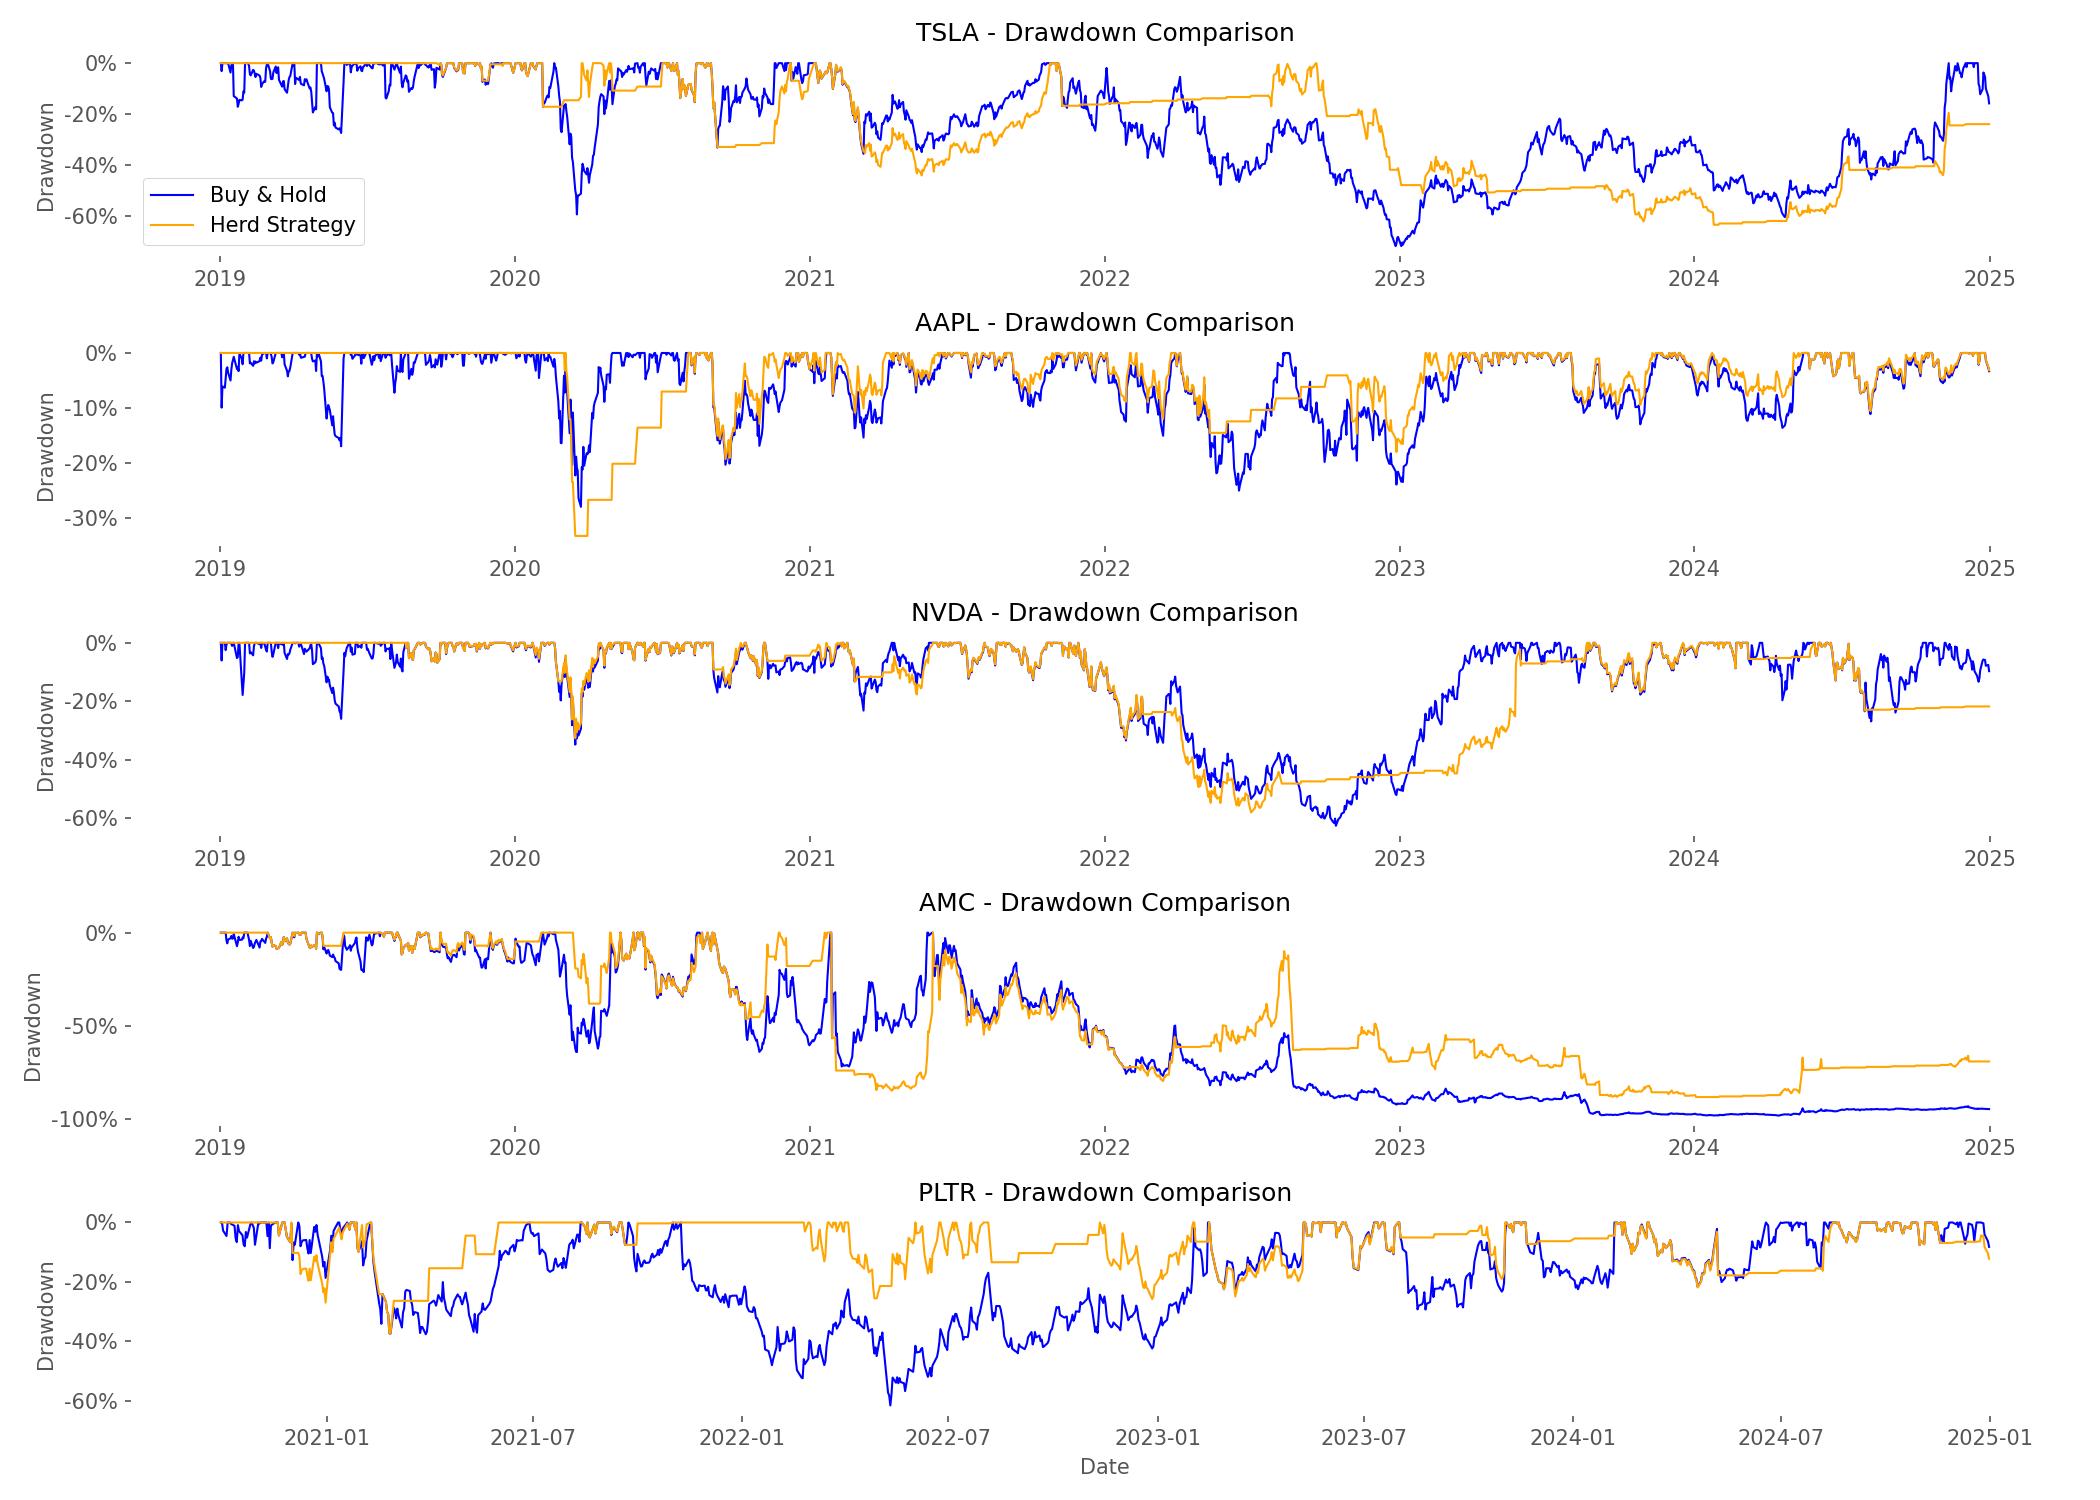
- AMC buy-and-hold investors endured a gut-wrenching 98.22% drawdown, while herd strategy limited the decline to 88.27%
- PLTR showed the biggest difference in drawdown protection: 61.49% for buy-and-hold vs. just 37.29% for the herd strategy
- Recovery periods from major drawdowns were typically shorter with the herd strategy
- Even for stocks where buy-and-hold won on returns, the herd strategy provided smoother performance with less severe declines
Risk-Return Profile: Finding the Sweet Spot
When we plotted risk against return using the Sharpe ratio (which measures risk-adjusted performance), an interesting pattern emerged:
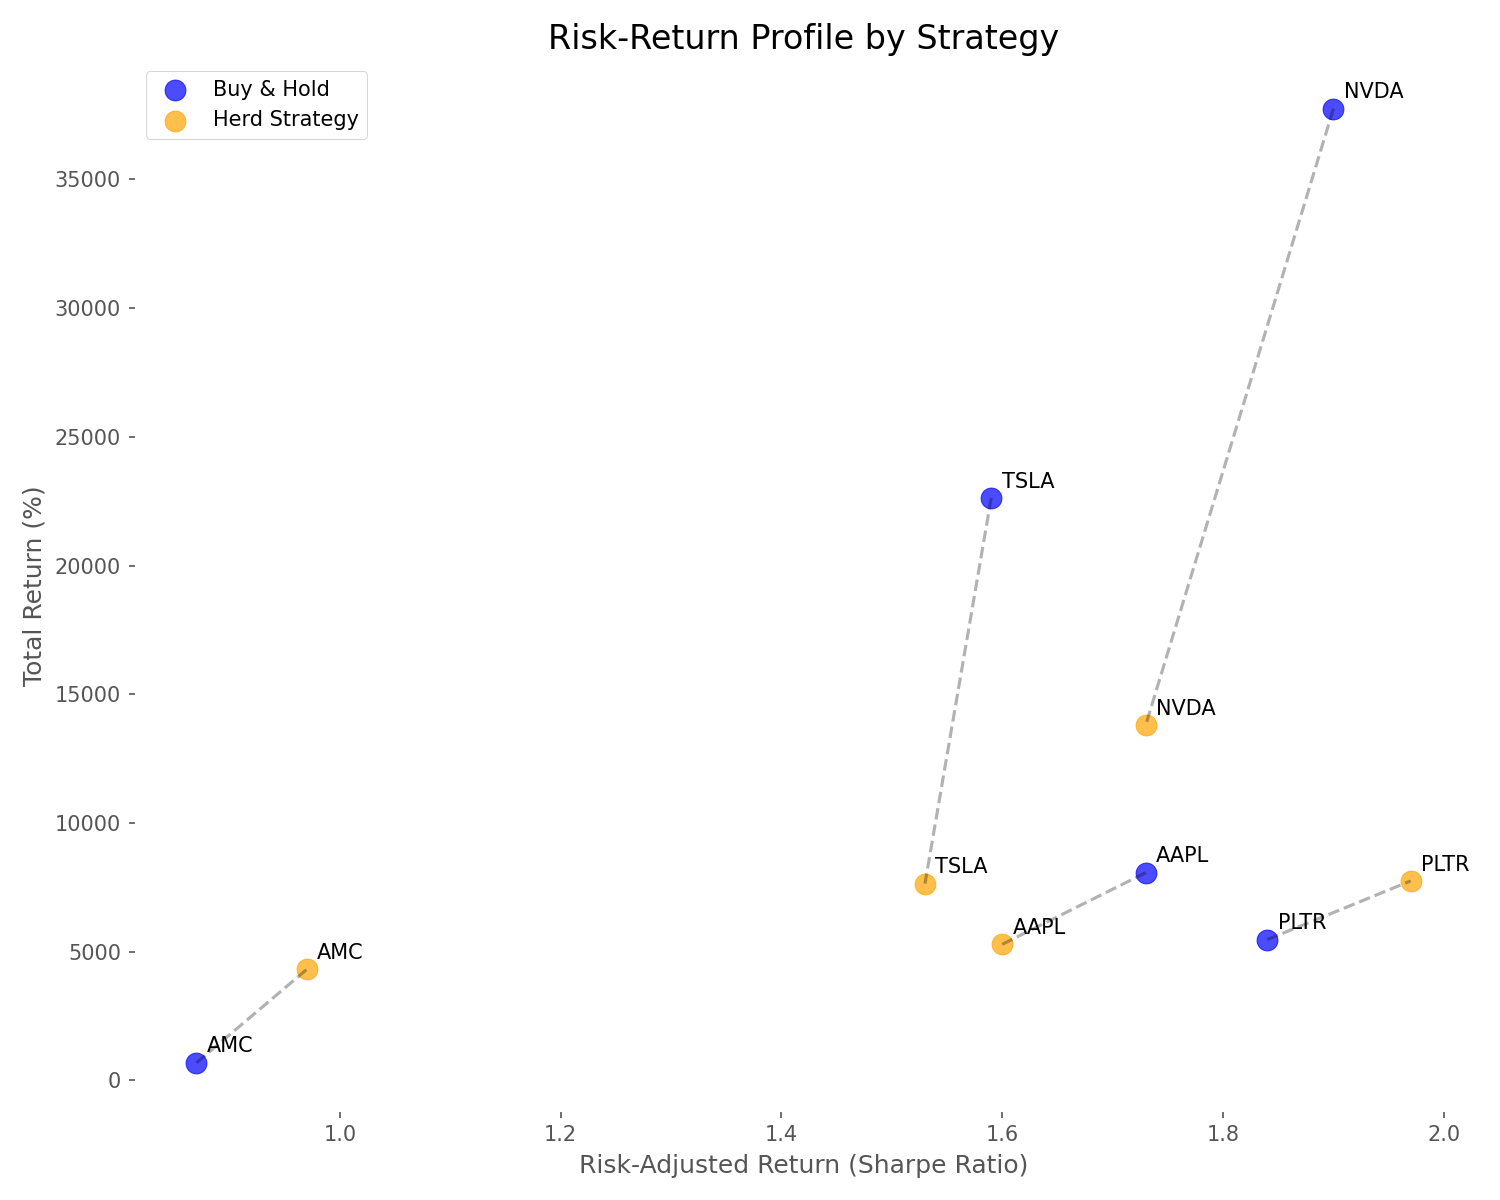
- NVDA had the best risk-adjusted return under buy-and-hold with a Sharpe ratio of 1.90
- PLTR had the best risk-adjusted return under the herd strategy with a Sharpe ratio of 1.97
- For volatile stocks (AMC, PLTR), the herd strategy delivered better risk-adjusted returns
- For stable growth stocks (AAPL, NVDA, TSLA), buy-and-hold provided better risk-adjusted performance
Trading Patterns: Volume Signals Work Better for Volatile Stocks
Our analysis of trading frequency and success rates revealed why the herd strategy performed differently across stocks:
- AMC had the highest trading frequency with 81 trades, reflecting its high volatility
- AAPL had the lowest trading frequency with just 14 trades, reflecting its relative stability
- Success rates (percentage of profitable trades) ranged from 0% for AAPL to 41.67% for PLTR
- Volume spikes were more reliable signals for volatile stocks than for stable growth stocks
Conclusion – Patience vs. Crowd Pressure
So, can volume-based herd behavior beat buy-and-hold? Our data shows it depends on what you're investing in. For quality growth stocks, patience is a virtue. For volatile stocks, following volume signals works better.
The key insight? Volume reveals crowd behavior, but whether to follow depends on the stock's characteristics. The wisest approach may be using both strategies selectively.
Comments (0)
No comments yet. Be the first to comment!