History, sectors, and simple ETF cues you can actually use
If you’ve ever wondered why Wall Street hangs on every Fed meeting, here’s the short answer: when the Fed cuts interest rates, it changes the price of money. Cheaper money tends to help companies (it’s easier to invest and grow) and households (debt costs fall), and that shifts how investors value future profits—especially for growth businesses. But there’s a catch: context matters. Cuts during a crisis can arrive while markets are still falling; cuts after inflation cools can turbo-charge risk appetite.
This post keeps things practical and plain-English. We’ll cover:
- How rate cuts influence stock prices (without the jargon),
- What actually happened in three big modern cycles (2001–2003, 2008–2009, 2020), and
- Which sectors (via easy tickers like XLK, XLP, XLF, XLY, XLC, XLE, XLU) tend to win or lag—and why.
Think of this as your friendly road map: defensives help you get through the fog, and growth/cyclicals help you make time on the open road once visibility improves. Let’s jump in.
A quick ETF cheat sheet (so the tickers make sense)
We’ll reference U.S. sector ETFs to keep things concrete:
- XLK = Information Technology (Apple, Microsoft… growth & software)
- XLF = Financials (banks, insurers, brokers)
- XLY = Consumer Discretionary (non-essentials like retail, autos, e-commerce)
- XLP = Consumer Staples (groceries, household goods—“everyday essentials”)
- XLV = Health Care (pharma, biotech, medical devices)
- XLE = Energy (oil & gas producers, services)
- XLU = Utilities (electric, water, gas—stable, dividend-y)
- XLC = Communication Services (internet/media platforms, streaming, ads)
- XLRE = Real Estate (REITs—property owners)
If you remember just two ideas: growth sectors (like XLK, XLY, XLC) benefit more when money is cheap, while defensive sectors (XLP, XLV, XLU) feel safer when the economy is shaky.
Part 1 — Why the Fed’s rate cuts move stocks
When investors ask, “What will the Fed do next?” they’re really asking, “Will borrowing money get cheaper or more expensive?”
- The Federal Reserve sets short-term interest rates. Those rates flow into mortgages, car loans, credit cards, and business loans.
- Rate cuts make borrowing cheaper. Companies can fund projects more easily; consumers have more cash left after interest payments.
- That can push earnings expectations higher and, crucially, it also lowers the discount rate used to value future profits—especially helpful for growth stocks whose big earnings arrive in the future.
There’s also psychology. A Fed “pivot” (switching from raising to cutting) often lifts sentiment before hard data improves. But context matters: if cuts arrive during a crisis, stocks can still drop first, then recover later once the worst is past. Keep that nuance in mind as we look at history.
Part 2 — What history says: three modern easing cycles
We’ll focus on three well-known episodes and talk in plain English about what happened and why.
1) Dot-Com Bust (2001–2003)
The Fed cut rates aggressively as the tech bubble deflated. Even so, the S&P 500 slid for a while and the Nasdaq—packed with over-valued dot-com names—was hit hardest (think deep, drawn-out bear market for tech). Stocks finally bottomed in October 2002, then 2003 delivered a powerful rebound.
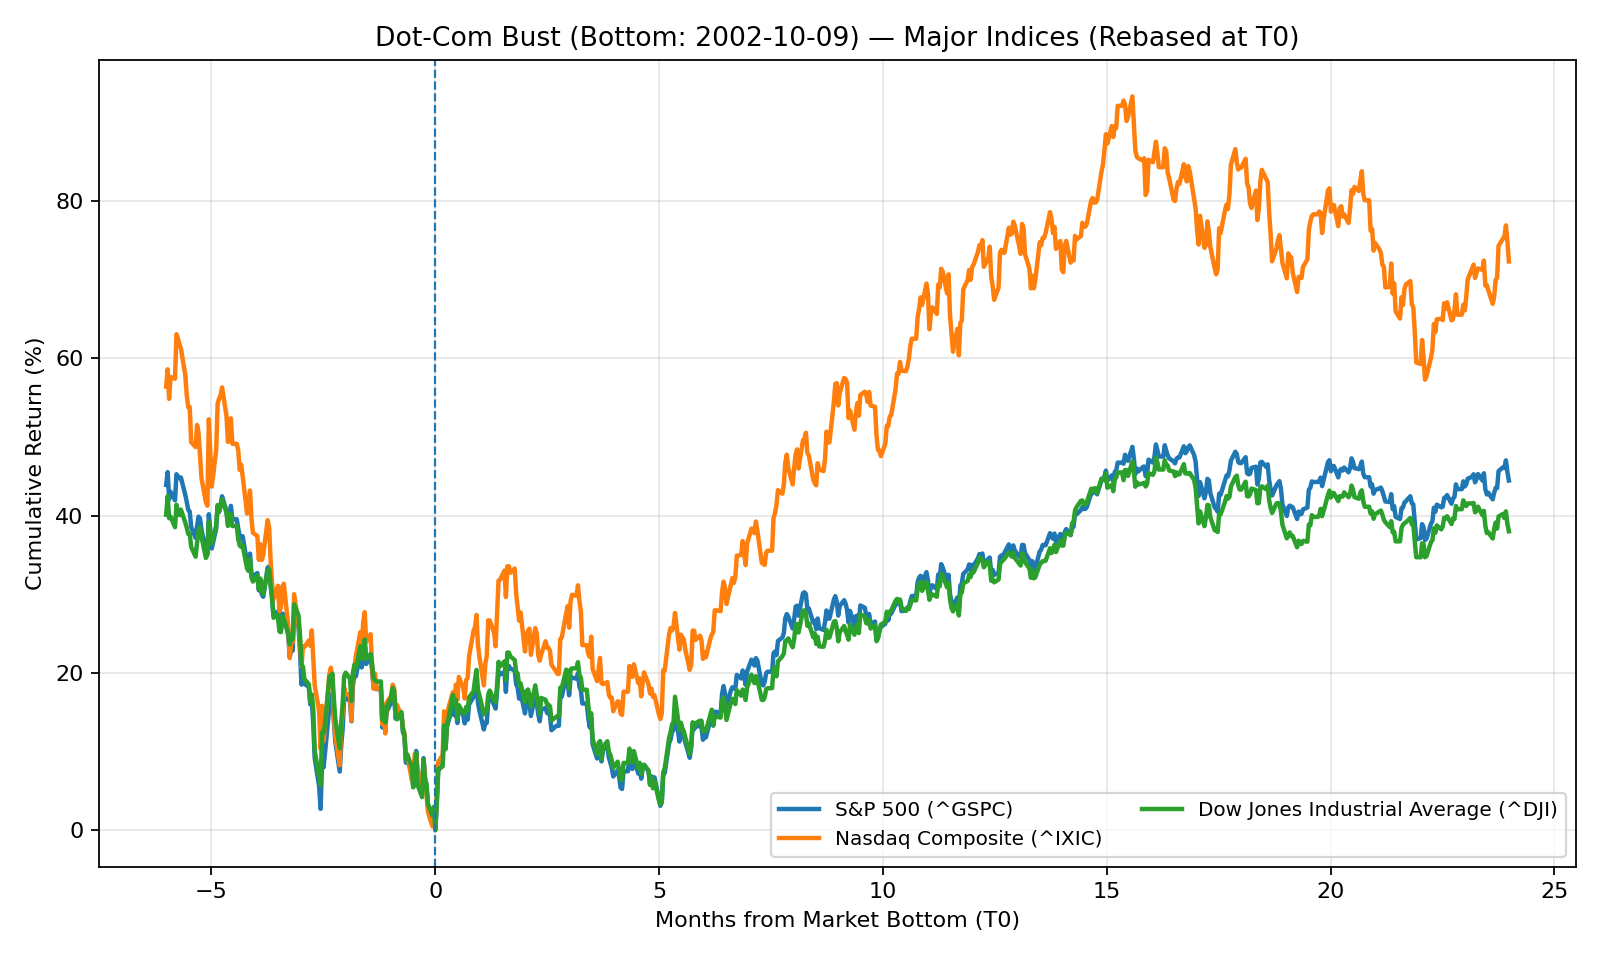
30-month window: T-6m → T+24m; rebased to 0% at T0.
Plain-English takeaway: rate cuts can plant the seeds of recovery, but when the problem is a bursting bubble, markets may need time to digest the excess. Tech (XLK) suffered most on the way down, then bounced hard once the economy stabilized. Defensive sectors like staples (XLP) and health care (XLV) held up better during the worst of the decline because people still buy toothpaste and medicine, recession or not.
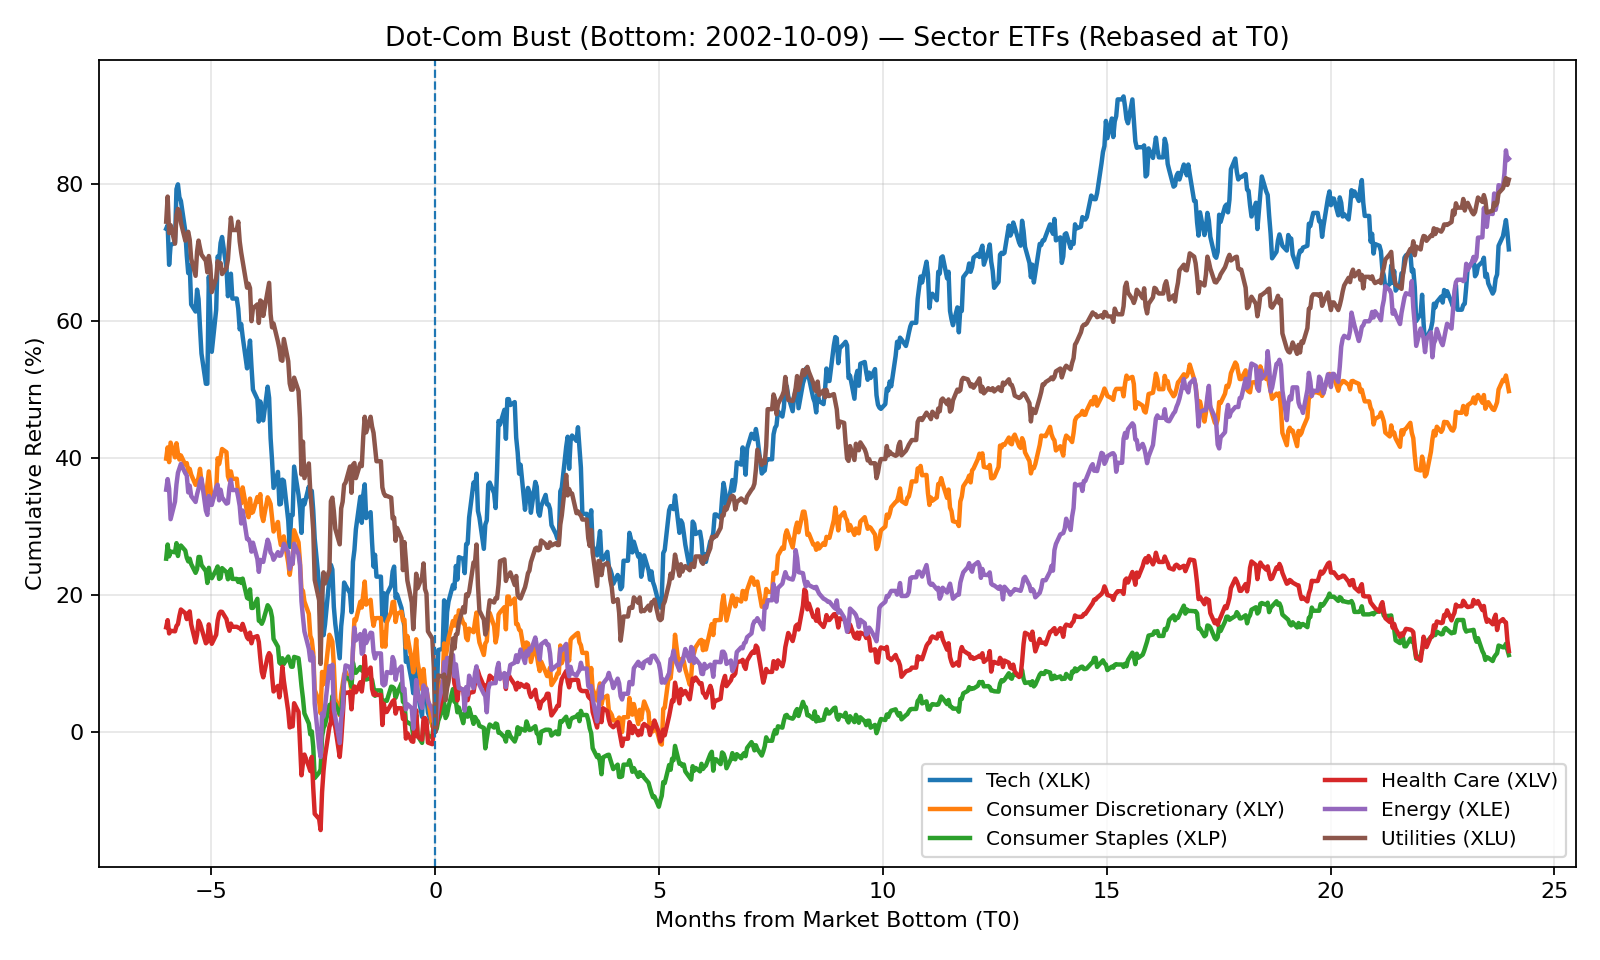
Tech and Consumer rebound vs. defensives; the sector split you’d expect after a bubble unwinds.
2) Global Financial Crisis (2008–2009)
The Fed slashed rates toward zero and added emergency programs, but stocks kept falling until March 2009. Why? This wasn’t just expensive stocks; it was a credit system breaking. Financials (XLF)—the center of the storm—were crushed. Once panic eased and policy support took hold, markets surged into a new bull market.
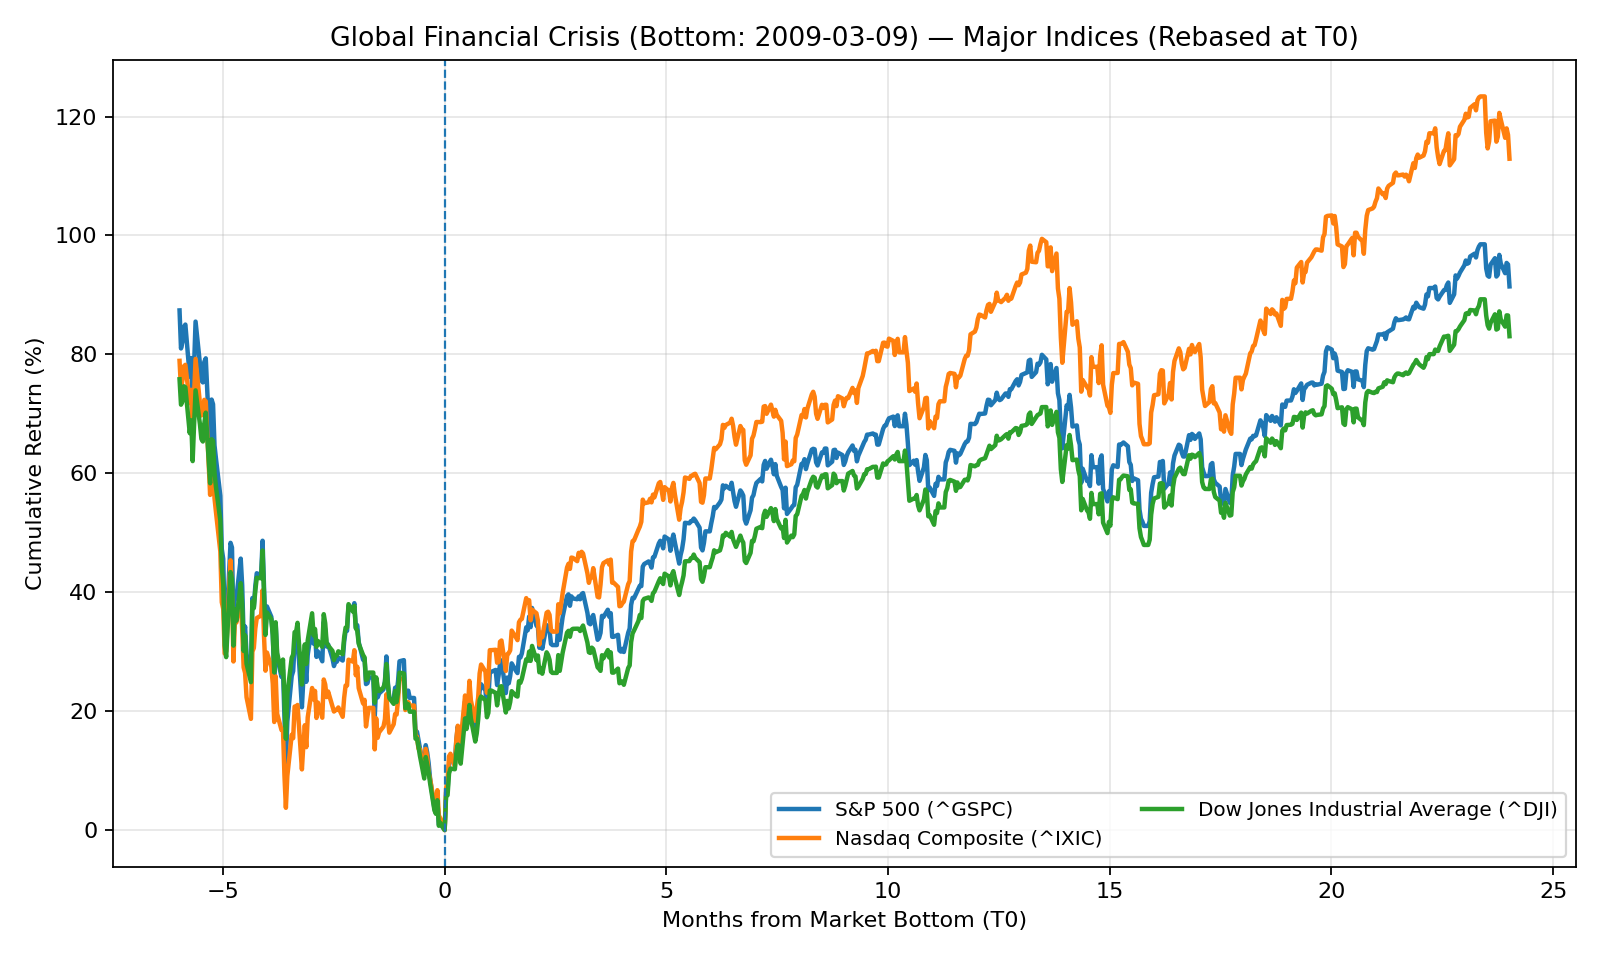
30-month window: T-6m → T+24m; rebased to 0% at T0.
Plain-English takeaway: when cuts arrive in a systemic crisis, stocks can keep sliding until the plumbing is fixed. Defensives (XLP, XLV, XLU) again lost less in the down-leg, but once the bottom formed, cyclicals and growth (XLK, XLY) ripped higher as confidence returned.
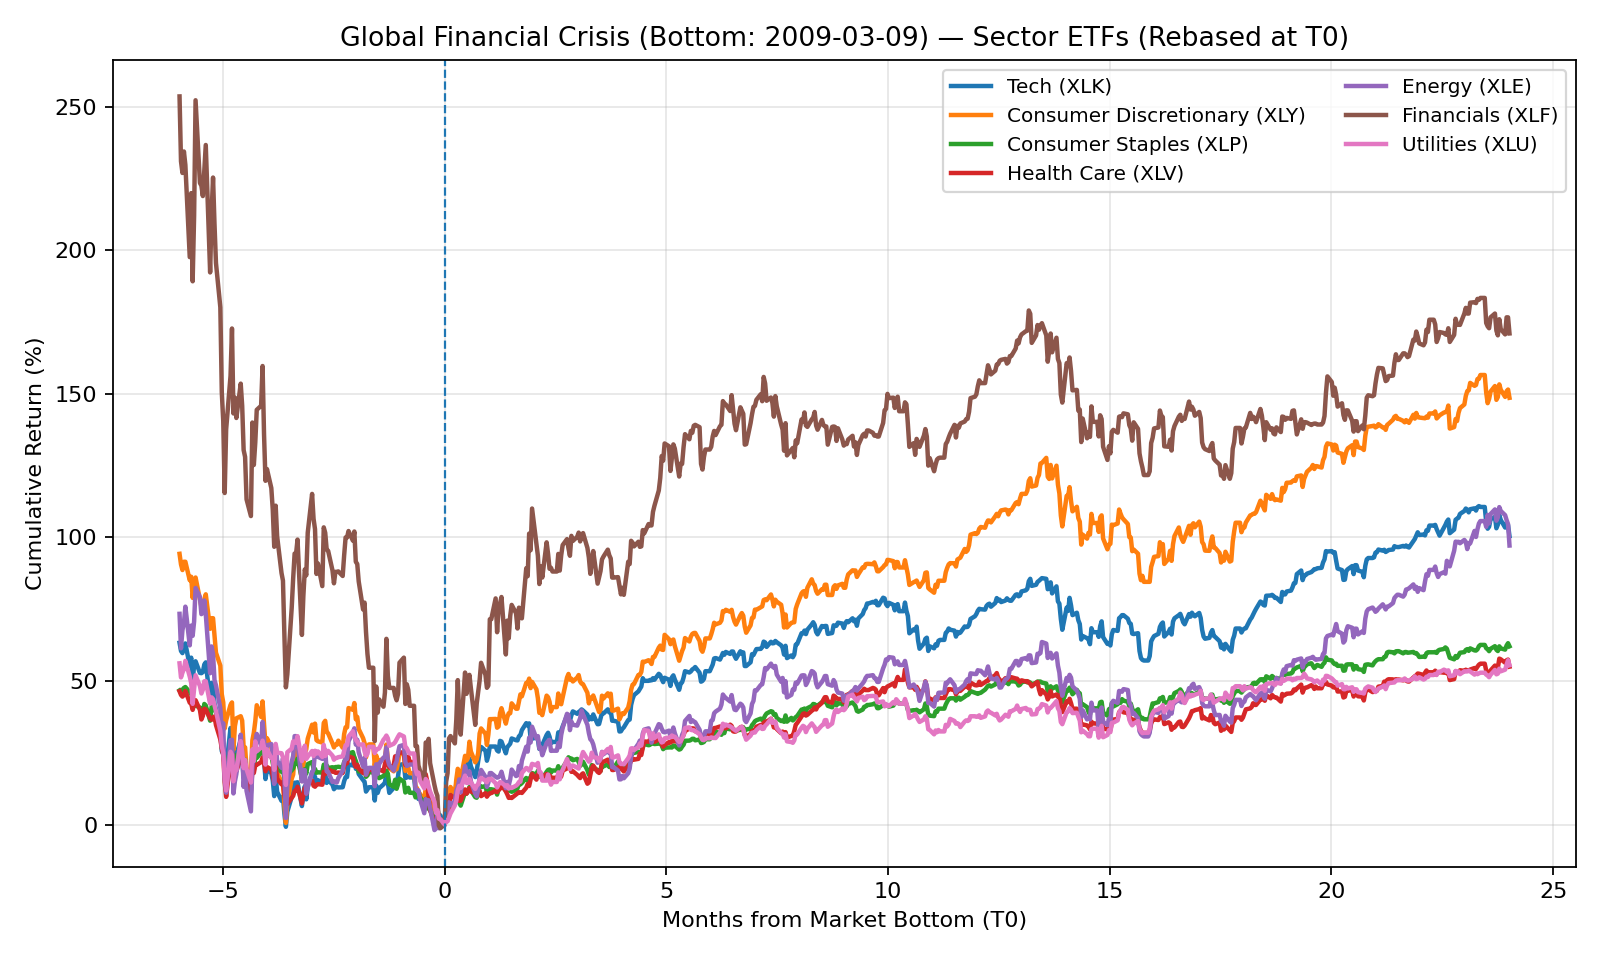
Defensives cushioned the fall; Tech & Discretionary sprinted off the bottom while Financials lagged.
3) COVID-19 Shock (2020)
The Fed took rates to 0% in days and opened massive liquidity programs. The crash was record-fast—and the rebound was too. Tech (XLK), e-commerce & consumer platforms (XLY), and internet/media (XLC) soared as the world went digital. Energy (XLE) plunged with oil demand, then roared back later as the economy reopened. Defensives were positive but lagged the rocket-ship recovery in growth.
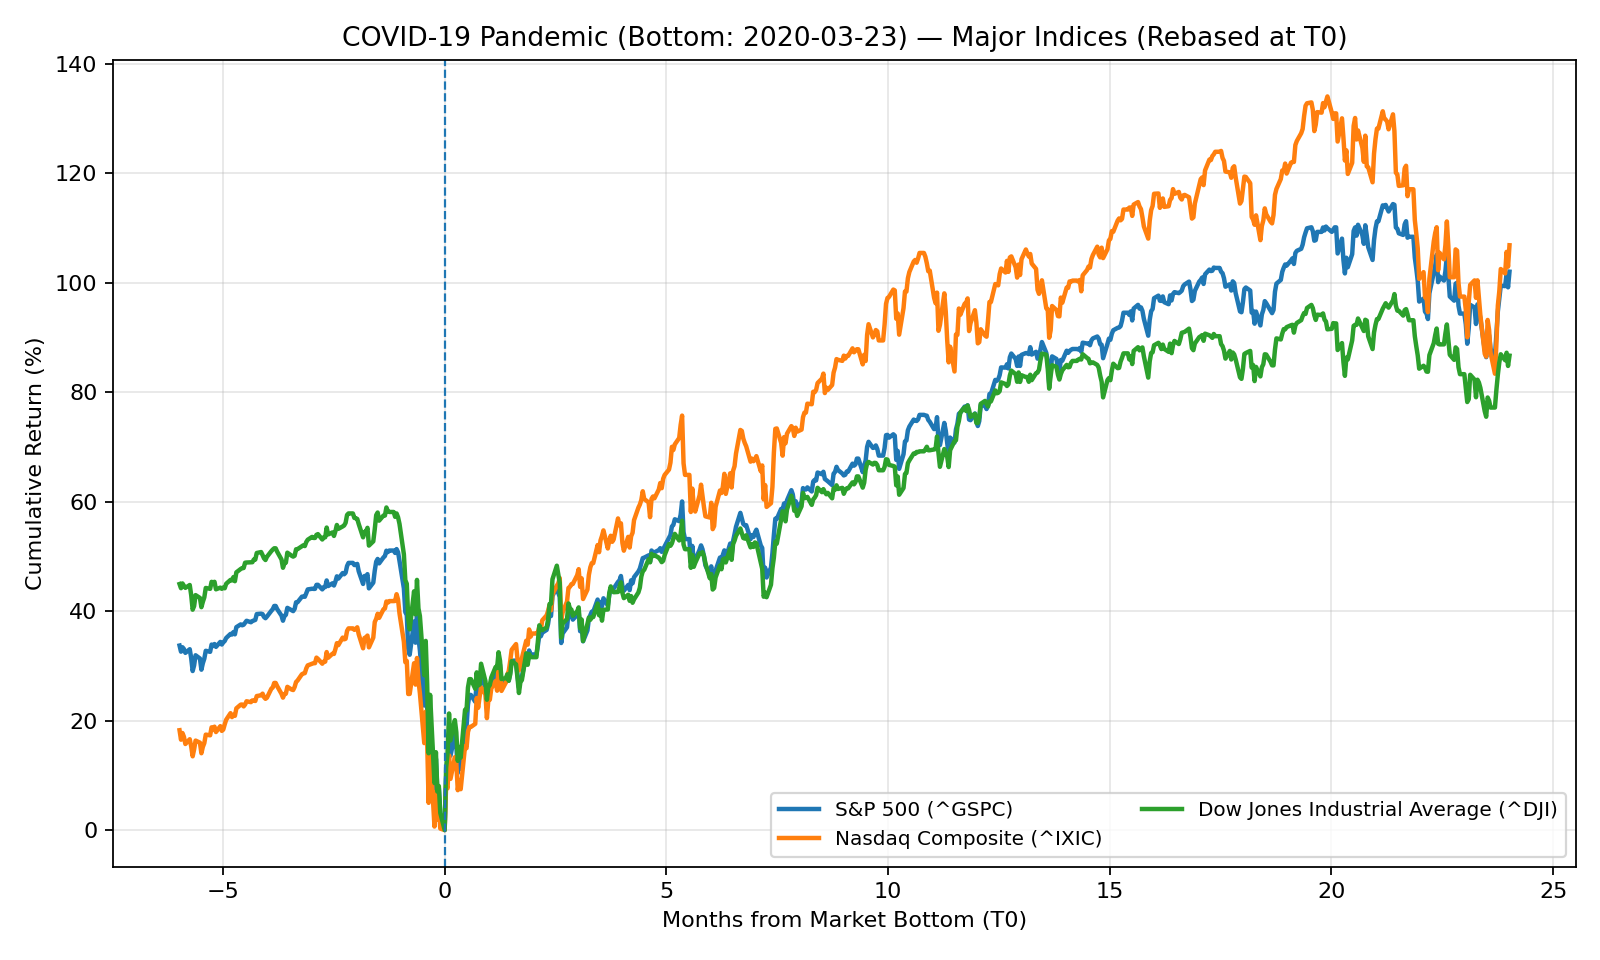
30-month window: T-6m → T+24m; rebased to 0% at T0.
Plain-English takeaway: in a short, external shock, rapid cuts plus fiscal support can drive a V-shaped recovery, with growth sectors leading first, then more cyclical groups catching up as reopening gathers steam.
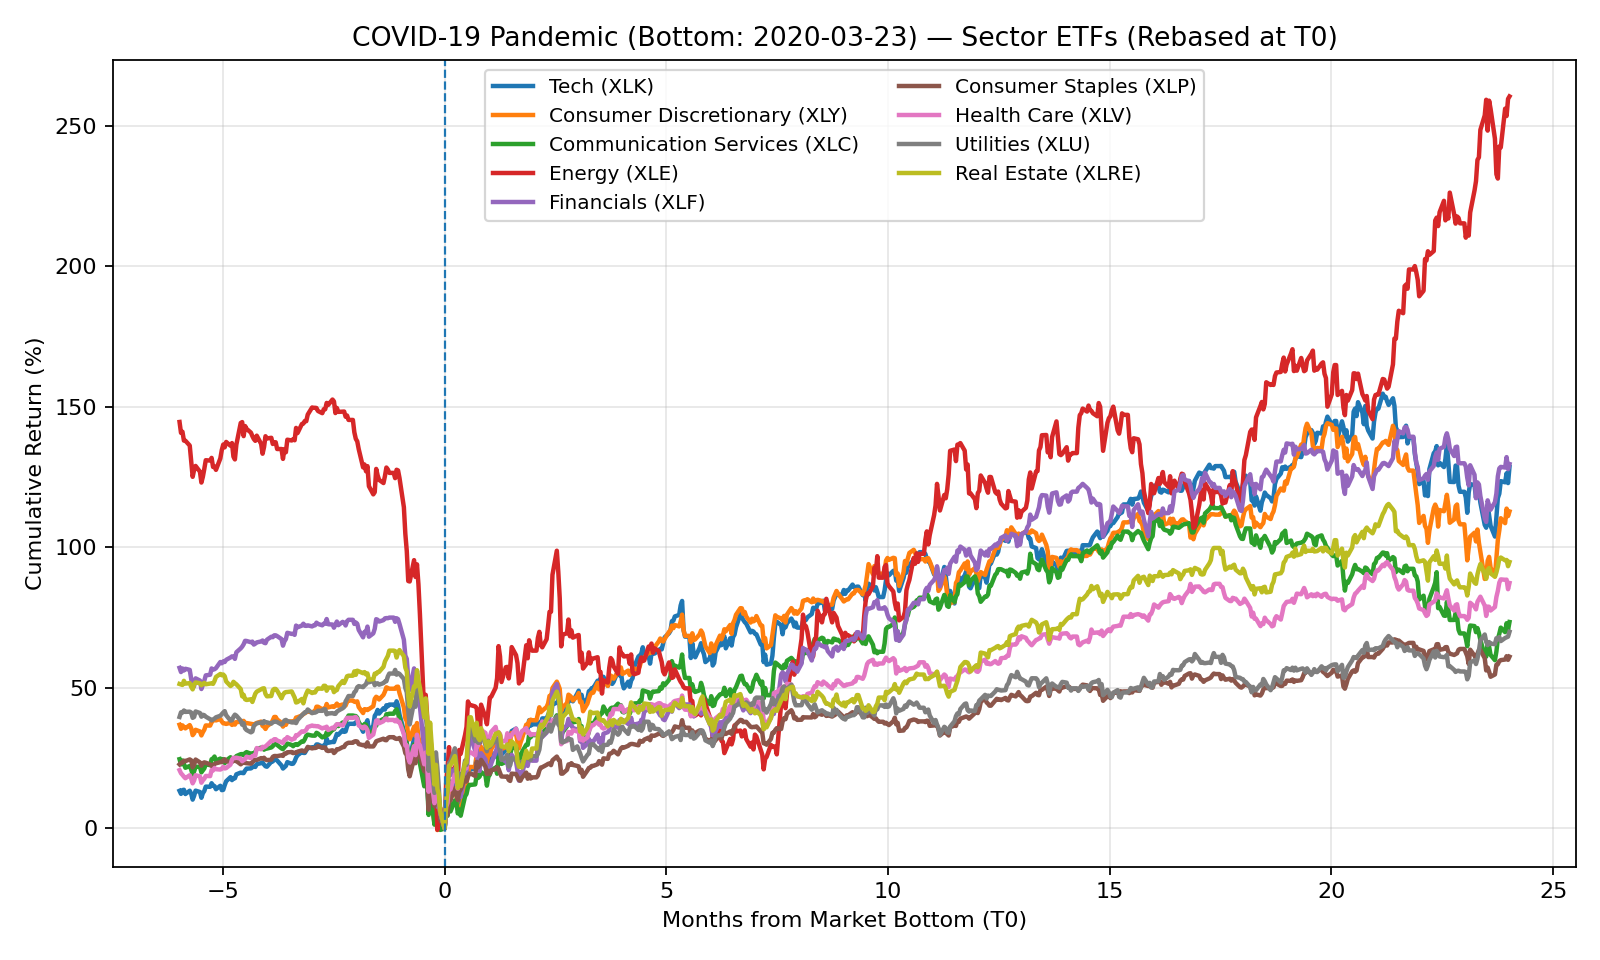
Growth-led surge (Tech/Discretionary/Comm), followed by Energy’s reopening catch-up.
Part 3 — Sector “winners & losers” when rates fall (and why)
Think of rate cuts as lowering gravity. Everything floats a little easier—but some balloons rise faster.
Who tends to win early?
- Defensives: XLP (Staples), XLV (Health Care), XLU (Utilities)
When recession risk is high, investors want steady demand and dividends. These sectors often fall less in the downturn and stabilize portfolios while the dust settles. Lower rates also make their cash flows and yields look more attractive versus bonds.
Who often wins big as recovery takes hold?
- Growth & Cyclicals: XLK (Tech), XLY (Discretionary), XLC (Comm Services)
As confidence returns, investors pay up for future earnings and operating leverage. Lower discount rates boost the math for growth stocks, and easier credit helps companies and consumers spend again. That’s why tech and consumer names often lead the first, furious leg off a market bottom.
Who commonly struggles in rate-cut recessions?
- XLF (Financials) can lag when the Fed slashes rates because net interest margins compress (banks earn less on the spread) and credit concerns rise. In 2008–09, financials were the epicenter and underperformed badly. In milder slowdowns, they may fare better, but they usually aren’t the first to lead.
- XLE (Energy) is more about demand than rates. If growth collapses (like 2020), oil demand does too, overwhelming any benefit from cheap money—at least at first. Later, when the economy reopens, energy can snap back hard.
How those patterns showed up in each cycle
- 2001–2003:
- During the fall: defensives (XLP, XLV) held up relatively better.
- In the rebound: tech (XLK) and consumer (XLY) outpaced as the economy normalized.
- 2008–2009:
- During the fall: defensives again lost less; financials (XLF) were hammered.
- In the rebound: tech (XLK) and discretionary (XLY) sprinted off the bottom; financials recovered but lagged the new leaders.
- 2020:
- During the fall: growth fell too—but far less than cyclical “real-world” sectors like energy.
- In the rebound: tech (XLK), discretionary (XLY) and comm services (XLC) led early on digital demand; energy (XLE) lagged first, then caught up on reopening.
Putting it to work (without being a pro)
If you don’t follow markets every day, here’s a simple, sensible way to think about positioning around a rate-cut cycle:
- In the fog (early cuts, recession risk high):
Favor defensives (XLP, XLV, XLU) to keep the portfolio sturdy while the economy and credit conditions stabilize. - As the fog lifts (bottoming & early recovery):
Start rotating into growth & cyclicals (XLK, XLY, XLC). This is typically where the fastest gains happen, because earnings expectations and risk appetite rise together. - Stay humble about “the epicenter.”
The sector at the heart of the crisis often lags: tech in the dot-com bust, financials in 2008, energy in 2020. Rate cuts help, but they don’t erase the core problem right away. - Remember time horizons.
Defensives often win the first 3–6 months after cuts (smaller drawdowns). Growth & cyclicals often win the next 6–24 months as recovery takes hold. You don’t need to pick a single “right” basket—step-rotate as evidence improves.
Final thought
Rate cuts are not a magic wand. They’re more like turning down the treadmill incline: running gets easier, but you still have to run. In bubbles or financial shocks, markets may drop first even as the Fed is cutting. But across modern history, once panic fades and policy support bites, risk assets recover—with defensives protecting the early innings and growth/cyclicals powering the middle game.
Comments (0)
No comments yet. Be the first to comment!